Cabela's 2006 Annual Report Download - page 67
Download and view the complete annual report
Please find page 67 of the 2006 Cabela's annual report below. You can navigate through the pages in the report by either clicking on the pages listed below, or by using the keyword search tool below to find specific information within the annual report.-
 1
1 -
2
-
3
-
4
-
5
-
6
-
7
-
8
-
9
-
10
-
11
-
12
-
13
-
14
-
15
-
16
-
17
-
18
-
19
-
20
-
21
-
22
-
23
-
24
-
25
-
26
-
27
-
28
-
29
-
30
-
31
-
32
-
33
-
34
-
35
-
36
-
37
-
38
-
39
-
40
-
41
-
42
-
43
-
44
-
45
-
46
-
47
-
48
-
49
-
50
-
51
-
52
-
53
-
54
-
55
-
56
-
 57
57 -
 58
58 -
 59
59 -
 60
60 -
 61
61 -
 62
62 -
 63
63 -
 64
64 -
 65
65 -
 66
66 -
 67
67 -
 68
68 -
 69
69 -
 70
70 -
 71
71 -
 72
72 -
 73
73 -
 74
74 -
 75
75 -
 76
76 -
 77
77 -
78
-
79
-
80
-
81
-
82
-
83
-
84
-
85
-
86
-
87
-
88
-
89
-
90
-
91
-
92
-
93
-
94
-
95
-
96
-
97
-
98
-
99
-
100
-
101
-
102
-
103
-
104
-
105
-
106
-
107
-
108
-
109
-
110
-
111
-
112
-
113
-
114
 |
 |

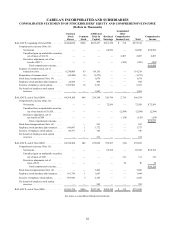
63
CABELA’S INCORPORATED AND SUBSIDIARIES
CONSOLIDATED STATEMENTS OF CASH FLOWS
(Dollars in Thousands)
Fiscal Years
2006 2005 2004
CASH FLOWS FROM OPERATING ACTIVITIES:
Net income ................................................................ $ 85,785 $ 72,569 $ 64,996
Adjustments to reconcile net income to net cash flows from operating activities:
Depreciation............................................................ 44,665 33,898 28,385
Amortization ........................................................... 894 1,014 1,458
Stock based compensation................................................. 3,615 941 1,674
Deferred income taxes.................................................... 24,030 11,308 (2,379 )
Other, net . . . . . . . . . . . . . . . . . . . . . . . . . . . . . . . . . . . . . . . . . . . . . . . . . . . . . . . . . . . . . . 1,188 (354 ) (2,599 )
Change in operating assets and liabilities:
Accounts receivable...................................................... (11,506) (3,803 ) (2,749 )
Proceeds from new securitizations . . . . . . . . . . . . . . . . . . . . . . . . . . . . . . . . . . . . . . . . . . 267,000 237,000 169,000
Origination of credit card loans held for sale, net of collections. . . . . . . . . . . . . . . . . . . . (325,382) (250,671 ) (205,006 )
Retained interests in securitized loans........................................ (12,818) (6,492 ) (359 )
Inventories............................................................. (87,779) (83,633 ) (50,239 )
Prepaid expenses and deferred catalog costs . . . . . . . . . . . . . . . . . . . . . . . . . . . . . . . . . . . 390 (11,724 ) (259 )
Other current assets ...................................................... (15,364) (10,973 ) 1,966
Land held for sale or development . . . . . . . . . . . . . . . . . . . . . . . . . . . . . . . . . . . . . . . . . . 602 5,554 (2,875 )
Accounts payable........................................................ 57,240 51,960 9,302
Accrued expenses and other liabilities. . . . . . . . . . . . . . . . . . . . . . . . . . . . . . . . . . . . . . . . 15,821 5,961 5,985
Gift certificates and credit card reward points. . . . . . . . . . . . . . . . . . . . . . . . . . . . . . . . . . 23,090 23,878 16,672
Accrued employee compensation and benefits . . . . . . . . . . . . . . . . . . . . . . . . . . . . . . . . . 875 5,322 (2,209 )
Income taxes payable..................................................... (14,120) (6,862 ) 13,413
Deferred compensation ................................................... (1,995) (1,445 ) 1,366
Deferred grant income.................................................... (1,274) (884 ) 1,116
Net cash provided by operating activities . . . . . . . . . . . . . . . . . . . . . . . . . . . . . . . . 54,957 72,564 46,659
CASH FLOWS FROM INVESTING ACTIVITIES:
Capital expenditures......................................................... (179,238) (194,659 ) (52,568 )
Purchases of marketable securities . . . . . . . . . . . . . . . . . . . . . . . . . . . . . . . . . . . . . . . . . . . . . . (23,397) (65,077 ) (74,492 )
Proceeds from retirements of marketable securities . . . . . . . . . . . . . . . . . . . . . . . . . . . . . . . . . 53,000 60,053 —
Maturities of marketable securities. . . . . . . . . . . . . . . . . . . . . . . . . . . . . . . . . . . . . . . . . . . . . . 1,065 6,135 4,959
Purchases of short-term investments . . . . . . . . . . . . . . . . . . . . . . . . . . . . . . . . . . . . . . . . . . . . (131,225) (21,000) (156,825)
Proceeds from sales or maturities of short-term investments . . . . . . . . . . . . . . . . . . . . . . . . . . 131,225 145,250 112,500
Change in credit card loans receivable, net . . . . . . . . . . . . . . . . . . . . . . . . . . . . . . . . . . . . . . . (5,308) (7,479 ) (5,313 )
Change in cash reserves for retained interests . . . . . . . . . . . . . . . . . . . . . . . . . . . . . . . . . . . . . 8,250 750 (7,500 )
Other, net.................................................................. 932 (4,590 ) 8,103
Net cash used in investing activities . . . . . . . . . . . . . . . . . . . . . . . . . . . . . . . . . . . . (144,696) (80,617 ) (171,136 )
CASH FLOWS FROM FINANCING ACTIVITIES:
Change in unpresented checks net of bank balance . . . . . . . . . . . . . . . . . . . . . . . . . . . . . . . . . (21,652) (13,001 ) (2,135 )
Change in time deposits, net................................................... (7,292) 8,829 18,995
Borrowings on lines of credit, inventory financing and short-term borrowing . . . . . . . . . . . . 398,080 554,137 53,106
Repayments on lines of credit, inventory financing and short-term borrowing . . . . . . . . . . . (383,203) (553,116 ) (53,106 )
Proceeds from issuance of long-term debt . . . . . . . . . . . . . . . . . . . . . . . . . . . . . . . . . . . . . . . . 215,000 — 98
Payments on long-term debt . . . . . . . . . . . . . . . . . . . . . . . . . . . . . . . . . . . . . . . . . . . . . . . . . . . (29,093) (28,326 ) (3,325 )
Proceeds from exercise of employee stock options, stock purchase plan and
2004 recapitalization ..................................................... 3,832 2,519 10,259
Excess tax benefits from exercise of stock options . . . . . . . . . . . . . . . . . . . . . . . . . . . . . . . . . 495 — —
Payment of debt issuance costs................................................. (448) — —
Issuance of common stock for initial public offering, net of transaction costs of $3,343 . . . . — — 114,219
Net decrease in employee savings plan . . . . . . . . . . . . . . . . . . . . . . . . . . . . . . . . . . . . . . . . . . — — (1,083 )
Repurchase of common stock .................................................. — — (1,273 )
Net cash provided by (used in) financing activities. . . . . . . . . . . . . . . . . . . . . . . . . 175,719 (28,958) 135,755
NET INCREASE (DECREASE) IN CASH AND CASH EQUIVALENTS . . . . . . . . . . . . . . . . 85,980 (37,011) 11,278
CASH AND CASH EQUIVALENTS, beginning of fiscal year. . . . . . . . . . . . . . . . . . . . . . . . . . 86,923 123,934 112,656
CASH AND CASH EQUIVALENTS, end of fiscal year . . . . . . . . . . . . . . . . . . . . . . . . . . . . . . . $ 172,903 $ 86,923 $ 123,934
See notes to consolidated financial statements.