Cabela's 2006 Annual Report Download - page 46
Download and view the complete annual report
Please find page 46 of the 2006 Cabela's annual report below. You can navigate through the pages in the report by either clicking on the pages listed below, or by using the keyword search tool below to find specific information within the annual report.-
 1
1 -
2
-
3
-
4
-
5
-
6
-
7
-
8
-
9
-
10
-
11
-
12
-
13
-
14
-
15
-
16
-
17
-
18
-
19
-
20
-
21
-
22
-
23
-
24
-
25
-
26
-
27
-
28
-
29
-
30
-
31
-
32
-
33
-
34
-
35
-
 36
36 -
 37
37 -
 38
38 -
 39
39 -
 40
40 -
 41
41 -
 42
42 -
 43
43 -
 44
44 -
 45
45 -
 46
46 -
 47
47 -
 48
48 -
 49
49 -
 50
50 -
 51
51 -
 52
52 -
 53
53 -
 54
54 -
 55
55 -
 56
56 -
57
-
58
-
59
-
60
-
61
-
62
-
63
-
64
-
65
-
66
-
67
-
68
-
69
-
70
-
71
-
72
-
73
-
74
-
75
-
76
-
77
-
78
-
79
-
80
-
81
-
82
-
83
-
84
-
85
-
86
-
87
-
88
-
89
-
90
-
91
-
92
-
93
-
94
-
95
-
96
-
97
-
98
-
99
-
100
-
101
-
102
-
103
-
104
-
105
-
106
-
107
-
108
-
109
-
110
-
111
-
112
-
113
-
114
 |
 |

42
Fiscal 2006 Fiscal 2005
(Unaudited)
First
Quarter
Second
Quarter
Third
Quarter
Fourth
Quarter
First
Quarter
Second
Quarter
Third
Quarter
Fourth
Quarter
(Dollars in Thousands Except Earnings Per Share)
Net revenue . . . . . . . . . . . . . . . . . . . $404,805 $387,263 $490,453 $781,003 $350,589 $343,872 $429,753 $675,447
Operating income . . . . . . . . . . . . . . 14,203 14,545 26,851 88,146 11,023 8,822 26,260 68,858
Net income . . . . . . . . . . . . . . . . . . . 9,083 8,356 14,994 53,352 7,767 6,016 16,275 42,511
Earnings per share—basic (1) . . . . $ 0.14 $ 0.13 $ 0.23 $ 0.82 $ 0.12 $ 0.09 $ 0.25 $ 0.66
Earnings per share—diluted (1) . . $ 0.14 $ 0.13 $ 0.23 $ 0.80 $ 0.12 $ 0.09 $ 0.25 $ 0.64
As a percentage of full year results:
Revenue . . . . . . . . . . . . . . . . . . . . . 19.6 % 18.8 % 23.8 % 37.8 % 19.5 % 19.1 % 23.9 % 37.5%
Operating income . . . . . . . . . . . . . . 9.9 % 10.1 % 18.7 % 61.3 % 9.6 % 7.7 % 22.8 % 59.9%
Net income . . . . . . . . . . . . . . . . . . . 10.6 % 9.7 % 17.5 % 62.2 % 10.7 % 8.3 % 22.4 % 58.6%
(1) Basic and diluted earnings per share are computed independently for each of the quarters presented.
Bank Asset Quality
We securitize a majority of our credit card loans. On a quarterly basis, we transfer eligible credit card loans
into a securitization trust. We are required to own at least a minimum twenty day average of 5.0% of the interests in
the securitization trust. Therefore, these retained loans have the same characteristics as those loans sold to outside
investors. Certain accounts are ineligible for securitization because they are delinquent at the time of sales to the
trust, originated from sources other than Cabela’s CLUB Visa credit cards and various other requirements. The total
amount of ineligible loans and receivables were $19.1 million and $14.1 million at fiscal year end 2006 and fiscal year
end 2005, respectively.
The quality of our managed credit card loan portfolio at any time reflects, among other factors, the creditworthiness
of the individual cardholders, general economic conditions, the success of our account management and collection
activities, and the life cycle stage of the portfolio. Our financial results are sensitive to changes in delinquencies and
net charge-offs of this portfolio. During periods of economic weakness, delinquencies and net charge-offs are more
likely to increase. We have sought to manage this sensitivity by selecting a customer base that has historically shown
it to be very creditworthy based on charge-off levels, credit bureau scores such as FICO scores and behavior scores.
The median FICO scores of our securitized loans were 785 and 778 in 2006 and 2005, respectively.
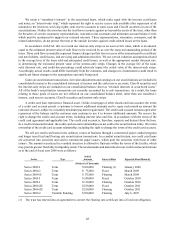
Our average managed credit card loans outstanding increased by $262.1 million, or 23.9%, to $1,357.7 million
in fiscal 2006 from $1,095.6 million in fiscal 2005. We believe that as credit card accounts mature they are less likely
to charge-off and less likely to be closed. The following table shows our managed loans outstanding at the end of
fiscal 2006 and 2005 by months since the account opened.
2006 2005
Loans
Outstanding
Percentage
of Total
Loans
Outstanding
Percentage of
Total
Months Since Account Opened (Dollars in Thousands)
6 months or less . . . . . . . . . . . . . . . . . . . . . . . . . . . . . . . . . . $ 105,101 6.3% $ 87,394 6.5%
7 – 12 months .................................... 105,296 6.3 83,531 6.2
13 – 24 months . . . . . . . . . . . . . . . . . . . . . . . . . . . . . . . . . . . 223,209 13.3 170,864 12.7
25 – 36 months . . . . . . . . . . . . . . . . . . . . . . . . . . . . . . . . . . . 193,384 11.6 170,886 12.8
37 – 48 months . . . . . . . . . . . . . . . . . . . . . . . . . . . . . . . . . . . 186,078 11.1 178,980 13.3
49 – 60 months . . . . . . . . . . . . . . . . . . . . . . . . . . . . . . . . . . . 191,372 11.4 190,011 14.2
61 – 72 months . . . . . . . . . . . . . . . . . . . . . . . . . . . . . . . . . . . 197,928 11.8 240,743 18.0
73 – 84 months . . . . . . . . . . . . . . . . . . . . . . . . . . . . . . . . . . . 247,771 14.8 83,701 6.3
85 + months ..................................... 223,925 13.4 134,710 10.0
Total ......................................... $1,674,064 100.0% $1,340,820 100.0%