Cabela's 2006 Annual Report Download - page 36
Download and view the complete annual report
Please find page 36 of the 2006 Cabela's annual report below. You can navigate through the pages in the report by either clicking on the pages listed below, or by using the keyword search tool below to find specific information within the annual report.-
 1
1 -
2
-
3
-
4
-
5
-
6
-
7
-
8
-
9
-
10
-
11
-
12
-
13
-
14
-
15
-
16
-
17
-
18
-
19
-
20
-
21
-
22
-
23
-
24
-
25
-
 26
26 -
 27
27 -
 28
28 -
 29
29 -
 30
30 -
 31
31 -
 32
32 -
 33
33 -
 34
34 -
 35
35 -
 36
36 -
 37
37 -
 38
38 -
 39
39 -
 40
40 -
 41
41 -
 42
42 -
 43
43 -
 44
44 -
 45
45 -
 46
46 -
47
-
48
-
49
-
50
-
51
-
52
-
53
-
54
-
55
-
56
-
57
-
58
-
59
-
60
-
61
-
62
-
63
-
64
-
65
-
66
-
67
-
68
-
69
-
70
-
71
-
72
-
73
-
74
-
75
-
76
-
77
-
78
-
79
-
80
-
81
-
82
-
83
-
84
-
85
-
86
-
87
-
88
-
89
-
90
-
91
-
92
-
93
-
94
-
95
-
96
-
97
-
98
-
99
-
100
-
101
-
102
-
103
-
104
-
105
-
106
-
107
-
108
-
109
-
110
-
111
-
112
-
113
-
114
 |
 |
32
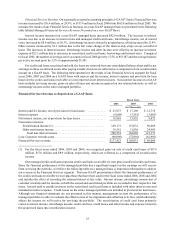
opening of the destination retail store, Direct revenue in that market has historically resumed its growth rate prior to
the new retail store opening. We were very pleased with the continued growth rate of our Direct business in fiscal
2006, a year in which we increased our Retail sales by $200.2 million and also increased our Direct business by $44.3
million, or 4.2%, to reach nearly $1.1 billion in sales.
Effect of system enhancements on our operations. Through the completion of system enhancements over the
past several years, we expect to see improvements in inventory turns, replenishment and fill rates, product availability
and delivery.
Gasoline prices. Increases in gasoline prices may affect our Retail sales more negatively than our other retail
competition. We rely on destination retail store formats where some of our customers must drive hundreds of miles
to visit our stores. If gasoline prices increase, customers may opt to shop at competitors located closer to large
populations. Our new retail store locations in 2006, as well as future planned locations, are primarily located closer
to larger metropolitan areas, which we believe will help mitigate the impact of gasoline price increases on our Retail
sales. Our Direct business has historically been less affected by gasoline price increases. Our multi-channel strategy
helps mitigate our exposure to increases in gasoline prices.
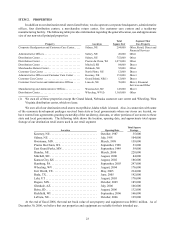
Land sales. In fiscal 2006, the amount of land sales decreased by $15.1 million to $10.5 million compared to
$25.6 million in fiscal 2005. These land sales are included in other revenue and pertain to sales of land around our
destination retail stores. The cost of the land is reflected in cost of other revenue as this land was held for sale. The
timing of the land sales and the varying gross profit of these land sales can have an impact on our annual and quarterly
results of operations. The margin on the sales of land can vary significantly depending on the circumstances and
development plan for each location. In fiscal 2006, land sales contributed $4.9 million of gross profit on $10.5
million in sales, a 46.6% gross margin on land sales, compared to $4.8 million of gross profit on $25.6 million in
land sales for fiscal 2005, an 18.9% gross margin on land sales. The sale of land around our destination retail stores
creates an opportunity for increased revenues and return on our overall destination retail concept.
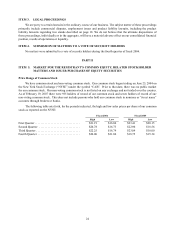
Revenue
Revenue consists of sales of our products and services. Direct revenue includes sales from orders placed over
the phone, by mail and through our website and includes customer shipping charges. Retail revenue includes all
sales made at our destination retail stores and is driven by sales at new stores and changes in comparable store sales.
A store is included in our comparable store sales base on the first day of the month following the fifteen month
anniversary of its opening or expansion by greater than 25% of total square footage. Financial Services revenue
includes securitization income, interest income and interchange and other fees net of reward program costs, interest
expense and credit losses from our credit card operations. Other revenue consists primarily of land sales around our
destination retail stores and our non-merchandising outfitter services.
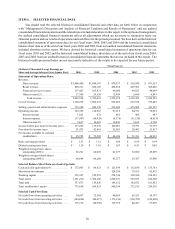
Cost of Revenue
Cost of revenue for our merchandising business includes cost of merchandise, shipping costs, inventory shrink
and other miscellaneous costs. However, it does not include occupancy costs, depreciation and amortization, direct
labor or warehousing costs, which are included in selling, general and administrative expenses. Our Financial
Services segment does not have costs classified as cost of revenue. Other cost of revenue includes the basis in land
that we have sold.
Selling, General and Administrative Expenses
Selling, general and administrative expenses include directly identifiable operating costs and other expenses,
as well as depreciation and amortization. For our Direct segment, these operating costs primarily consist of catalog
development, production and circulation costs, Internet advertising costs and order processing costs. For our Retail
segment, these costs primarily consist of payroll, store occupancy, utilities and advertising costs. For our Financial
Services segment, these costs primarily consist of advertising costs, marketing fees paid to our other segments, third
party data processing costs associated with servicing accounts, payroll and other administrative fees. Our Other
expenses include shared-service costs, general and administrative expenses and the costs of operating our various
other small businesses described above which are not included in any of our segments. Shared-service costs include
costs for services shared by two or more of our business segments (principally our Direct and Retail segments) and