Cabela's 2006 Annual Report Download - page 41
Download and view the complete annual report
Please find page 41 of the 2006 Cabela's annual report below. You can navigate through the pages in the report by either clicking on the pages listed below, or by using the keyword search tool below to find specific information within the annual report.-
 1
1 -
2
-
3
-
4
-
5
-
6
-
7
-
8
-
9
-
10
-
11
-
12
-
13
-
14
-
15
-
16
-
17
-
18
-
19
-
20
-
21
-
22
-
23
-
24
-
25
-
26
-
27
-
28
-
29
-
30
-
 31
31 -
 32
32 -
 33
33 -
 34
34 -
 35
35 -
 36
36 -
 37
37 -
 38
38 -
 39
39 -
 40
40 -
 41
41 -
 42
42 -
 43
43 -
 44
44 -
 45
45 -
 46
46 -
 47
47 -
 48
48 -
 49
49 -
 50
50 -
 51
51 -
52
-
53
-
54
-
55
-
56
-
57
-
58
-
59
-
60
-
61
-
62
-
63
-
64
-
65
-
66
-
67
-
68
-
69
-
70
-
71
-
72
-
73
-
74
-
75
-
76
-
77
-
78
-
79
-
80
-
81
-
82
-
83
-
84
-
85
-
86
-
87
-
88
-
89
-
90
-
91
-
92
-
93
-
94
-
95
-
96
-
97
-
98
-
99
-
100
-
101
-
102
-
103
-
104
-
105
-
106
-
107
-
108
-
109
-
110
-
111
-
112
-
113
-
114
 |
 |
37
Selling, General and Administrative Expenses
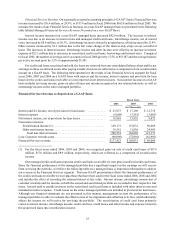
Selling, general and administrative expenses increased by $95.0 million, or 15.3%, to $715.4 million in fiscal
2006 compared to $620.4 million in fiscal 2005. Selling, general and administrative expenses were 34.7% of revenue
in fiscal 2006 compared to 34.5% of revenue in fiscal 2005. We recognized $3.6 million of stock based compensation
expense in fiscal 2006, which accounted for 0.175% of the 0.20% increase in selling, general and administrative
expenses as a percentage of total revenue. The most significant factors contributing to the increase in selling, general
and administrative expenses by segment included:
•Other selling, general and administrative expenses attributed to shared services increased by $27.2
million over the prior year primarily as a result of costs for strategic initiatives to expand and improve
our infrastructure. Wages and benefits increased by $17.2 million primarily due to increases in personnel
in our distribution centers as our merchandise revenue continues to grow including $2.4 million of stock
based compensation expense attributed to this segment included in wages and benefits. Depreciation
expense increased by $5.6 million due to two system upgrades implemented at the end of 2005, new
systems put in service during 2006 and new equipment purchases in our distribution centers. Contract
labor costs increased by $3.1 million due to consulting costs on various company projects related to
system upgrades and expansion. Equipment and software expenses increased $1.3 million primarily
related to increased software licenses. Other selling, general and administrative costs as a percentage of
consolidated revenue increased to 9.8% from 9.7%.
•Direct selling, general and administrative expenses increased by $9.2 million due to several factors.
Increases in selling, general and administrative costs included an increase in catalog costs of $8.4
million. Catalog costs increased to $160.3 million in fiscal 2006 from $151.9 million in fiscal 2005.
As a percentage of Direct revenue, catalog costs increased to 14.7% in fiscal 2006 from 14.5% in fiscal
2005. This increase in catalog costs as a percentage of our Direct revenue was due to higher postage
and print rates and three catalogs that were not circulated in the prior year. In addition, there were
increases in salary, wages and related benefits of $3.0 million due to positions added to support our
growth, increases in incidental equipment and software expenses of $3.3 million, specifically related
to our website. Advertising increased by $2.5 million over the prior year. The increase in advertising
was primarily driven by a new postcard promotion. Credit card discount fees increased by $0.7 million,
however as a percentage of total Direct revenue these costs were flat. These increases were largely offset
by an increase in the marketing fee paid to the Direct segment from the Financial Services segment of
$9.0 million, or 0.8% of Direct revenue.
•Retail selling, general and administrative expenses comprised $34.0 million of the total increase in selling,
general and administrative expense. New store operating costs related to our stores that were not open in the
comparable period of 2005 increased by $37.4 million. Total selling, general and administrative expenses
as a percentage of comparable store sales decreased by 0.5%, or $1.4 million. This decrease was primarily
driven by savings in salaries and wages and related benefits as the stores have been concentrating on labor
scheduling practices. Pre-opening costs were primarily flat compared to fiscal 2005 as we opened the
same amount of stores in both years. Retail corporate overhead costs, net of marketing reimbursements,
as a percentage of Retail revenue decreased by 0.4%, or $1.9 million, compared to fiscal 2005 as increases
in salaries and related benefits were offset by an increase in the marketing fee paid to the Retail segment
from the Financial Services segment of $6.5 million, or 0.8% of Retail revenue.
•Financial Services selling, general and administrative expenses comprised $24.6 million of the total
increase in selling, general and administrative expense. This was primarily due to increased marketing
fees of $15.5 million paid to our other segments. Advertising and promotional costs increased by $6.7
million due to increases in new account acquisition costs and increases in Visa assessments, which
are driven by increases in credit card transactions. Third party data processing services related to our
credit card processing increased by $1.5 million as the number of credit card accounts and credit card
transactions increased. Postage increased $0.8 million due to increases in the number of accounts and
postage rate increases.