Cabela's 2006 Annual Report Download - page 74
Download and view the complete annual report
Please find page 74 of the 2006 Cabela's annual report below. You can navigate through the pages in the report by either clicking on the pages listed below, or by using the keyword search tool below to find specific information within the annual report.-
 1
1 -
2
-
3
-
4
-
5
-
6
-
7
-
8
-
9
-
10
-
11
-
12
-
13
-
14
-
15
-
16
-
17
-
18
-
19
-
20
-
21
-
22
-
23
-
24
-
25
-
26
-
27
-
28
-
29
-
30
-
31
-
32
-
33
-
34
-
35
-
36
-
37
-
38
-
39
-
40
-
41
-
42
-
43
-
44
-
45
-
46
-
47
-
48
-
49
-
50
-
51
-
52
-
53
-
54
-
55
-
56
-
57
-
58
-
59
-
60
-
61
-
62
-
63
-
 64
64 -
 65
65 -
 66
66 -
 67
67 -
 68
68 -
 69
69 -
 70
70 -
 71
71 -
 72
72 -
 73
73 -
 74
74 -
 75
75 -
 76
76 -
 77
77 -
 78
78 -
 79
79 -
 80
80 -
 81
81 -
 82
82 -
 83
83 -
 84
84 -
85
-
86
-
87
-
88
-
89
-
90
-
91
-
92
-
93
-
94
-
95
-
96
-
97
-
98
-
99
-
100
-
101
-
102
-
103
-
104
-
105
-
106
-
107
-
108
-
109
-
110
-
111
-
112
-
113
-
114
 |
 |

70
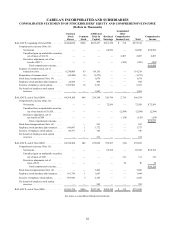
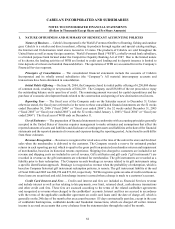
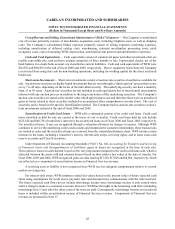
CABELA’S INCORPORATED AND SUBSIDIARIES
NOTES TO CONSOLIDATED FINANCIAL STATEMENTS
(Dollars in Thousands Except Share and Per Share Amounts)
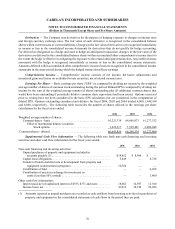
Derivatives — The Company uses derivatives for the purpose of hedging exposure to changes in interest rates
and foreign currency exchange rates. The fair value of each derivative is recognized in the consolidated balance
sheets within current assets or current liabilities. Changes in the fair value of derivatives are recognized immediately
as income or loss in the consolidated income statements for derivatives that do not qualify for hedge accounting.
For derivatives designated as a hedge and used to hedge an anticipated transaction, changes in the fair value of the
derivatives are deferred in the consolidated balance sheets within accumulated other comprehensive income (loss) to
the extent the hedge is effective in mitigating the exposure to the related anticipated transaction. Any ineffectiveness
associated with the hedge is recognized immediately as income or loss in the consolidated income statements.
Amounts deferred within accumulated other comprehensive income (loss) are recognized in the consolidated income
statements in the same period during which the hedged transaction affects earnings.
Comprehensive Income — Comprehensive income consists of net income, derivative adjustments and
unrealized gains and losses on available-for-sale securities, net of related income taxes.
Earnings Per Share — Basic earnings per share (“EPS”) is computed by dividing net income by the weighted
average number of shares of common stock outstanding during the period. Diluted EPS is computed by dividing net
income by the sum of the weighted average number of shares outstanding plus all additional common shares that
would have been outstanding if potentially dilutive common share equivalents had been issued. Options exercised
prior to vesting have not been considered in the basic EPS calculation, but are considered in the computation of
diluted EPS. Options outstanding considered anti-dilutive for fiscal 2006, 2005 and 2004 totaled 6,000, 1,444,186
and 6,000, respectively. The following table reconciles the number of shares utilized in the earnings per share
calculations for the fiscal years ended:
2006 2005 2004
Weighted average number of shares:
Common shares - basic . . . . . . . . . . . . . . . . . . . . . . . . . . . . . . . . . . . 65,221,339 64,668,973 61,277,352
Effect of incremental dilutive securities:
Stock options . . . . . . . . . . . . . . . . . . . . . . . . . . . . . . . . . . . . 1,422,517 1,599,401 2,000,048
Common shares - diluted . . . . . . . . . . . . . . . . . . . . . . . . . . . . . . . . . . . . 66,643,856 66,268,374 63,277,400
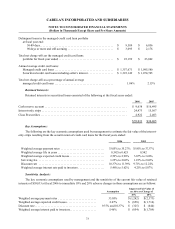
Supplemental Cash Flow Information — The following table sets forth non-cash financing and investing
activities and other cash flow information for the fiscal years ended:
2006 2005 2004
Non-cash financing and investing activities:
Unpaid purchases of property and equipment included in
accounts payable (1)........................................ $19,852 $ 8,498 $ —
Capital lease obligations. . . . . . . . . . . . . . . . . . . . . . . . . . . . . . . . . . . . . . . . 5,649 — 8,728
Transfer of land to held for sale or development from property and
equipment (construction in progress) . . . . . . . . . . . . . . . . . . . . . . . . . . . 10,764 — —
Contribution of land........................................... — — 6,038
Contribution of assets in exchange for investment in
entity (less than 50% owned) . . . . . . . . . . . . . . . . . . . . . . . . . . . . . . . . . — — 3,400
Other cash flow information:
Interest paid, net of capitalized interest of $355, $371 and none. . . . . . . . . 18,662 14,597 11,360
Income taxes, net ............................................. 41,012 38,354 24,026
(1) Amounts reported as unpaid purchases are recorded as cash outflows from investing activities for purchases of
property and equipment in the consolidated statements of cash flows in the period they are paid.