Cabela's 2006 Annual Report Download - page 37
Download and view the complete annual report
Please find page 37 of the 2006 Cabela's annual report below. You can navigate through the pages in the report by either clicking on the pages listed below, or by using the keyword search tool below to find specific information within the annual report.-
 1
1 -
2
-
3
-
4
-
5
-
6
-
7
-
8
-
9
-
10
-
11
-
12
-
13
-
14
-
15
-
16
-
17
-
18
-
19
-
20
-
21
-
22
-
23
-
24
-
25
-
26
-
 27
27 -
 28
28 -
 29
29 -
 30
30 -
 31
31 -
 32
32 -
 33
33 -
 34
34 -
 35
35 -
 36
36 -
 37
37 -
 38
38 -
 39
39 -
 40
40 -
 41
41 -
 42
42 -
 43
43 -
 44
44 -
 45
45 -
 46
46 -
 47
47 -
48
-
49
-
50
-
51
-
52
-
53
-
54
-
55
-
56
-
57
-
58
-
59
-
60
-
61
-
62
-
63
-
64
-
65
-
66
-
67
-
68
-
69
-
70
-
71
-
72
-
73
-
74
-
75
-
76
-
77
-
78
-
79
-
80
-
81
-
82
-
83
-
84
-
85
-
86
-
87
-
88
-
89
-
90
-
91
-
92
-
93
-
94
-
95
-
96
-
97
-
98
-
99
-
100
-
101
-
102
-
103
-
104
-
105
-
106
-
107
-
108
-
109
-
110
-
111
-
112
-
113
-
114
 |
 |

33
include receiving, distribution and storage costs, merchandising, quality assurance costs and corporate occupancy
costs. General and administrative expenses include costs associated with general corporate management and shared
departmental services such as management information systems, finance, human resources and legal.
Operating Income and Gross Profit
Operating income is defined as revenue less cost of revenue and selling, general and administrative expenses.
Given the variety of segments we report and the different cost classifications inherent in each of their respective
businesses, it is difficult to compare our consolidated results on the basis of gross profit, or the difference between
revenue and cost of revenue. We believe that operating income presents a more meaningful measure of our consolidated
operating performance than gross profit because of the following factors:
• our Financial Services segment does not have costs classified as cost of revenue which results in a
disproportionate gross profit contribution for this segment;
• we do not include occupancy costs, depreciation, direct labor or warehousing costs in cost of revenue,
which affects comparability to other retailers who may account differently for some or all of these costs;
and
• we have historically attempted to price our customer shipping charges to generally match our shipping
expenses, which reduces gross profit as a percentage of Direct revenue.
Consequently, we believe that operating income is the best metric to compare the performance and profitability
of our segments to each other and to judge our consolidated performance because it includes all applicable revenue
and cost items.
Results of Operations
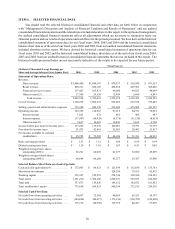
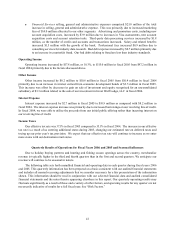
Our fiscal year ends on the Saturday closest to December 31. All fiscal years presented consisted of 52 weeks.
Our operating results for fiscal years 2006, 2005 and 2004, expressed as a percentage of revenue, were as follows:
Fiscal Years
2006 2005 2004
Revenue .................................................. 100.00% 100.00% 100.00%
Cost of revenue ............................................ 58.37 59.14 59.49
Gross profit (exclusive of depreciation and amortization). . . . . . . . . 41.63 40.86 40.51
Selling, general and administrative expenses . . . . . . . . . . . . . . . . . . . . . 34.67 34.47 34.26
Operating income .......................................... 6.96 6.39 6.25
Interest income.......................................... 0.09 0.04 0.03
Interest expense ......................................... (0.87) (0.61) (0.53)
Other income (net)....................................... 0.47 0.59 0.67
Total other income (expense). . . . . . . . . . . . . . . . . . . . . . . . . . . . . . . . . . (0.31) 0.02 0.17
Income before provision for income taxes . . . . . . . . . . . . . . . . . . . . . . . 6.65 6.41 6.42
Income tax expense......................................... 2.49 2.38 2.25
Net income................................................ 4.16% 4.03% 4.17%