Cabela's 2006 Annual Report Download - page 48
Download and view the complete annual report
Please find page 48 of the 2006 Cabela's annual report below. You can navigate through the pages in the report by either clicking on the pages listed below, or by using the keyword search tool below to find specific information within the annual report.-
 1
1 -
2
-
3
-
4
-
5
-
6
-
7
-
8
-
9
-
10
-
11
-
12
-
13
-
14
-
15
-
16
-
17
-
18
-
19
-
20
-
21
-
22
-
23
-
24
-
25
-
26
-
27
-
28
-
29
-
30
-
31
-
32
-
33
-
34
-
35
-
36
-
37
-
 38
38 -
 39
39 -
 40
40 -
 41
41 -
 42
42 -
 43
43 -
 44
44 -
 45
45 -
 46
46 -
 47
47 -
 48
48 -
 49
49 -
 50
50 -
 51
51 -
 52
52 -
 53
53 -
 54
54 -
 55
55 -
 56
56 -
 57
57 -
 58
58 -
59
-
60
-
61
-
62
-
63
-
64
-
65
-
66
-
67
-
68
-
69
-
70
-
71
-
72
-
73
-
74
-
75
-
76
-
77
-
78
-
79
-
80
-
81
-
82
-
83
-
84
-
85
-
86
-
87
-
88
-
89
-
90
-
91
-
92
-
93
-
94
-
95
-
96
-
97
-
98
-
99
-
100
-
101
-
102
-
103
-
104
-
105
-
106
-
107
-
108
-
109
-
110
-
111
-
112
-
113
-
114
 |
 |

44
borrowings under our revolving credit facility and access to debt markets, such as the private placement of long-term
debt securities we completed in February 2006. While we generally have been able to manage our cash needs during
peak periods, if any disruption occurred to our funding sources, or if we underestimated our cash needs, we would
be unable to purchase inventory and otherwise conduct our merchandising business to its maximum effectiveness,
which would result in reduced revenue and profits.
The primary cash requirements of our Financial Services segment relate to the generation of credit card loans
and the purchase of points used in the Cabela’s CLUB Visa customer loyalty rewards program from our merchandising
business. The bank obtains funds for these cash requirement purposes through various financing activities, which
include funding from securitization transactions, borrowing under federal funds bank credit facilities, accepting
certificates of deposit and generating cash from operations. Our bank’s charter is limited to issuing credit cards and
accepting brokered certificates of deposit of one hundred thousand dollars or more, and it does not accept demand
deposits or make non-credit card loans. Consequently, our bank cannot lend money to Cabela’s Incorporated or
our other affiliates. The bank is subject to capital requirements imposed by Nebraska banking law and the Visa
membership rules, and its ability to pay dividends is limited by Nebraska and federal banking law.
We continue to monetize our economic development bonds for future retail destination store expansion. In the
second quarter of fiscal 2006, $53.0 million in bonds we owned related to our Wheeling, West Virginia retail store
and distribution center were retired in connection with a transaction whereby we took a subordinate position on the
remaining bonds we hold related to this location. These remaining bonds are classified on our consolidated balance
sheet as marketable securities with a value of approximately $42.9 million. We have received notification from the
bondholders that they intend to retire the remainder of this issuance in 2007.
We are also focused on improving our inventory position in relation to sales growth through technological
investments. Inventory at our comparable stores declined 9.7% at the end of fiscal year 2006 compared to 2005.
We are optimistic that we will continue to see our inventory growth slow in relation to our merchandise sales growth
as we continue to enhance our multi-channel merchandising systems.
We believe that we will have sufficient capital available from current cash on hand, expected future operations,
additional monetization of our economic development bonds, our revolving credit facility and other borrowing
sources to fund our existing operations and growth plans for the next 12 to 18 months.
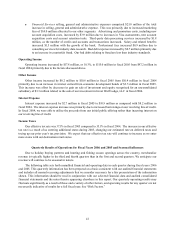
Operating, Investing and Financing Activities
The following table presents changes in our cash and cash equivalents for the fiscal years ended:
2006 2005 2004
(In Thousands)
Net cash provided by operating activities . . . . . . . . . . . $ 54,957 $ 72,564 $ 46,659
Net cash used in investing activities . . . . . . . . . . . . . . . $(144,696) $ (80,617) $(171,136)
Net cash provided by (used in) financing activities . . . . $ 175,719 $ (28,958) $ 135,755
Cash provided by operating activities decreased $17.6 million for fiscal 2006 compared to fiscal 2005. This
net decrease was primarily due to a $51.0 million net decrease between years related to the bank’s funding from
securitization transactions. For fiscal 2006, the bank used cash for credit card originations (net of cash received from
collections, proceeds from new securitizations and changes in retained interests) of $71.2 million compared to $20.2
million in 2005. Cash used for inventory increased $4.1 million over 2005 as we added four new destination retail
stores. Cash used for income taxes payable also increased by $7.3 million over 2005 due to the timing of federal
and state income tax payments and the increased profitability of the Company. In addition, increases totaling $17.0
million comparing fiscal 2006 over 2005 relate to the use of cash from accounts receivable, land held for sale and
other assets. Partially offsetting these decreases to cash from operating activities was a net increase of $40.8 million
in net income adjusted for non-cash expenditures for deferred income taxes, depreciation and amortization, stock-
based compensation and other items. Cash provided from prepaid expenses and deferred catalog costs increased
by $12.1 million over 2005 primarily due to the timing of catalog production costs. Cash was also provided from
various liabilities and accruals that increased by a net of $3.7 million over 2005. In addition, accounts payable
increased by $5.3 million from 2005 due to net increases in inventory payables of $10.3 million over 2005, partially
offset by decreases of $3.9 million in the payable to the third party processor for the bank’s credit card transactions
and $1.1 million in payables for catalog costs. The decreases are related to third party processor timing issues from
2005 and the timing in the catalog production work.