Cabela's 2006 Annual Report Download - page 79
Download and view the complete annual report
Please find page 79 of the 2006 Cabela's annual report below. You can navigate through the pages in the report by either clicking on the pages listed below, or by using the keyword search tool below to find specific information within the annual report.-
 1
1 -
2
-
3
-
4
-
5
-
6
-
7
-
8
-
9
-
10
-
11
-
12
-
13
-
14
-
15
-
16
-
17
-
18
-
19
-
20
-
21
-
22
-
23
-
24
-
25
-
26
-
27
-
28
-
29
-
30
-
31
-
32
-
33
-
34
-
35
-
36
-
37
-
38
-
39
-
40
-
41
-
42
-
43
-
44
-
45
-
46
-
47
-
48
-
49
-
50
-
51
-
52
-
53
-
54
-
55
-
56
-
57
-
58
-
59
-
60
-
61
-
62
-
63
-
64
-
65
-
66
-
67
-
68
-
 69
69 -
 70
70 -
 71
71 -
 72
72 -
 73
73 -
 74
74 -
 75
75 -
 76
76 -
 77
77 -
 78
78 -
 79
79 -
 80
80 -
 81
81 -
 82
82 -
 83
83 -
 84
84 -
 85
85 -
 86
86 -
 87
87 -
 88
88 -
 89
89 -
90
-
91
-
92
-
93
-
94
-
95
-
96
-
97
-
98
-
99
-
100
-
101
-
102
-
103
-
104
-
105
-
106
-
107
-
108
-
109
-
110
-
111
-
112
-
113
-
114
 |
 |

75
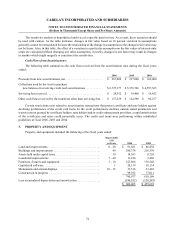
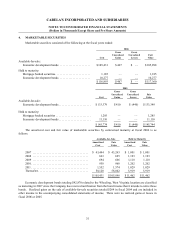
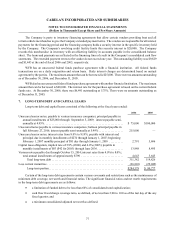
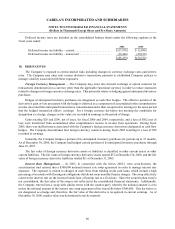
CABELA’S INCORPORATED AND SUBSIDIARIES
NOTES TO CONSOLIDATED FINANCIAL STATEMENTS
(Dollars in Thousands Except Share and Per Share Amounts)
4. MARKETABLE SECURITIES
Marketable securities consisted of the following at the fiscal years ended:
2006
Cost
Gross
Unrealized
Gains
Gross
Unrealized
Losses
Fair
Value
Available-for-sale:
Economic development bonds . . . . . . . . . . . . . . . . . . . . . $ 105,431 $ 467 $ — $ 105,898
Held to maturity:
Mortgage backed securities . . . . . . . . . . . . . . . . . . . . . . . . 1,185 — — 1,185
Economic development bonds . . . . . . . . . . . . . . . . . . . . . 10,277 — — 10,277
$ 116,893 $ 467 $ — $ 117,360
2005
Cost
Gross
Unrealized
Gains
Gross
Unrealized
Losses
Fair
Value
Available-for-sale:
Economic development bonds . . . . . . . . . . . . . . . . . . . . . . $ 133,379 $ 410 $ (440 ) $ 133,349
Held to maturity:
Mortgage backed securities . . . . . . . . . . . . . . . . . . . . . . . . 1,285 — — 1,285
Economic development bonds . . . . . . . . . . . . . . . . . . . . . . 11,110 — — 11,110
$ 145,774 $ 410 $ (440 ) $ 145,744
The amortized cost and fair value of marketable securities by contractual maturity at fiscal 2006 is as
follows:
Available-for-Sale Held to Maturity
Amortized
Cost
Fair
Value
Amortized
Cost
Fair
Value
2007 ...................................... $ 43,444 $ 43,263 $ 1,001 $ 1,001
2008 ...................................... 663 625 1,193 1,193
2009 ...................................... 694 666 1,118 1,118
2010 ....................................... 958 968 1,202 1,202
2011 ....................................... 1,552 1,574 1,029 1,029
Thereafter . . . . . . . . . . . . . . . . . . . . . . . . . . . . . . . . . . 58,120 58,802 5,919 5,919
$ 105,431 $ 105,898 $ 11,462 $ 11,462
Economic development bonds totaling $42,870 related to the Wheeling, West Virginia location are classified
as maturing in 2007 since the Company has received notification from the bond trustee that it intends to retire these
bonds. Realized gains on the sale of available-for-sale securities totaled $264 in fiscal 2004 and are included in
other income in the accompanying consolidated statements of income. There were no realized gains or losses in
fiscal 2006 or 2005.