Cabela's 2006 Annual Report Download - page 78
Download and view the complete annual report
Please find page 78 of the 2006 Cabela's annual report below. You can navigate through the pages in the report by either clicking on the pages listed below, or by using the keyword search tool below to find specific information within the annual report.-
 1
1 -
2
-
3
-
4
-
5
-
6
-
7
-
8
-
9
-
10
-
11
-
12
-
13
-
14
-
15
-
16
-
17
-
18
-
19
-
20
-
21
-
22
-
23
-
24
-
25
-
26
-
27
-
28
-
29
-
30
-
31
-
32
-
33
-
34
-
35
-
36
-
37
-
38
-
39
-
40
-
41
-
42
-
43
-
44
-
45
-
46
-
47
-
48
-
49
-
50
-
51
-
52
-
53
-
54
-
55
-
56
-
57
-
58
-
59
-
60
-
61
-
62
-
63
-
64
-
65
-
66
-
67
-
 68
68 -
 69
69 -
 70
70 -
 71
71 -
 72
72 -
 73
73 -
 74
74 -
 75
75 -
 76
76 -
 77
77 -
 78
78 -
 79
79 -
 80
80 -
 81
81 -
 82
82 -
 83
83 -
 84
84 -
 85
85 -
 86
86 -
 87
87 -
 88
88 -
89
-
90
-
91
-
92
-
93
-
94
-
95
-
96
-
97
-
98
-
99
-
100
-
101
-
102
-
103
-
104
-
105
-
106
-
107
-
108
-
109
-
110
-
111
-
112
-
113
-
114
 |
 |

74
CABELA’S INCORPORATED AND SUBSIDIARIES
NOTES TO CONSOLIDATED FINANCIAL STATEMENTS
(Dollars in Thousands Except Share and Per Share Amounts)
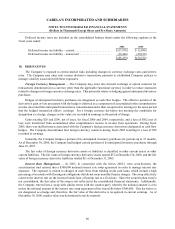
The sensitivity analysis is hypothetical and is as of a specific point in time. As a result, these scenarios should
be used with caution. As the table indicates, changes in fair value based on 10 percent variation in assumptions
generally cannot be extrapolated because the relationship of the change in assumption to the change in fair value may
not be linear. Also, in this table, the effect of a variation in a particular assumption on the fair values of interest-only
strips are calculated without changing any other assumption; in reality, changes in one factor may result in changes
in another which might magnify or counteract the sensitivities.
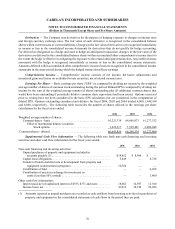
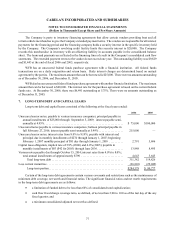
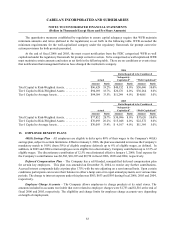
Cash Flows from Securitizations:
The following table summarizes the cash flows received from the securitization trust during the fiscal years
ended:
2006 2005 2004
Proceeds from new securitizations, net. . . . . . . . . . . . . . . . . . . . . . . . . . $ 267,000 $ 237,000 $ 169,000
Collections used by the trust to purchase
new balances in revolving credit card securitizations . . . . . . . . . . . . $ 6,727,177 $ 5,578,746 $ 4,597,365
Servicing fees received . . . . . . . . . . . . . . . . . . . . . . . . . . . . . . . . . . . . . . $ 24,352 $ 19,468 $ 16,452
Other cash flows received by the transferor other than servicing fees. . $ 157,259 $ 124,396 $ 94,277
Certain restrictions exist related to securitization transactions that protect certificate and note holders against
declining performance of the credit card loans. In the event performance declines outside stated parameters and
waivers are not granted by certificate holders, note holders and/or credit enhancement providers, a rapid amortization
of the certificates and notes could potentially occur. The credit card loans were performing within established
guidelines at fiscal 2006, 2005 and 2004.
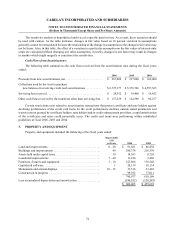
3. PROPERTY AND EQUIPMENT
Property and equipment included the following at the fiscal years ended:
Depreciable
Life
in Years 2006 2005
Land and improvements . . . . . . . . . . . . . . . . . . . . . . . . . . . . . . . . . . . . 0 - 20 $ 91,561 $ 86,458
Buildings and improvements . . . . . . . . . . . . . . . . . . . . . . . . . . . . . . . . 40 290,374 216,339
Assets held under capital lease . . . . . . . . . . . . . . . . . . . . . . . . . . . . . . . 30 14,363 8,728
Leasehold improvements . . . . . . . . . . . . . . . . . . . . . . . . . . . . . . . . . . . 7 - 40 13,226 3,486
Furniture, fixtures and equipment . . . . . . . . . . . . . . . . . . . . . . . . . . . . 3 - 10 227,866 176,548
Capitalized software ....................................... 3 20,139 18,134
Monuments and animal displays . . . . . . . . . . . . . . . . . . . . . . . . . . . . . 10 - 15 33,516 23,465
Construction in progress . . . . . . . . . . . . . . . . . . . . . . . . . . . . . . . . . . . 99,932 77,011
790,977 610,169
Less accumulated depreciation and amortization . . . . . . . . . . . . . . . . (190,912 ) (150,547 )
$ 600,065 $ 459,622