Cabela's 2006 Annual Report Download - page 32
Download and view the complete annual report
Please find page 32 of the 2006 Cabela's annual report below. You can navigate through the pages in the report by either clicking on the pages listed below, or by using the keyword search tool below to find specific information within the annual report.-
 1
1 -
2
-
3
-
4
-
5
-
6
-
7
-
8
-
9
-
10
-
11
-
12
-
13
-
14
-
15
-
16
-
17
-
18
-
19
-
20
-
21
-
 22
22 -
 23
23 -
 24
24 -
 25
25 -
 26
26 -
 27
27 -
 28
28 -
 29
29 -
 30
30 -
 31
31 -
 32
32 -
 33
33 -
 34
34 -
 35
35 -
 36
36 -
 37
37 -
 38
38 -
 39
39 -
 40
40 -
 41
41 -
 42
42 -
43
-
44
-
45
-
46
-
47
-
48
-
49
-
50
-
51
-
52
-
53
-
54
-
55
-
56
-
57
-
58
-
59
-
60
-
61
-
62
-
63
-
64
-
65
-
66
-
67
-
68
-
69
-
70
-
71
-
72
-
73
-
74
-
75
-
76
-
77
-
78
-
79
-
80
-
81
-
82
-
83
-
84
-
85
-
86
-
87
-
88
-
89
-
90
-
91
-
92
-
93
-
94
-
95
-
96
-
97
-
98
-
99
-
100
-
101
-
102
-
103
-
104
-
105
-
106
-
107
-
108
-
109
-
110
-
111
-
112
-
113
-
114
 |
 |

28
• EBITDA does not reflect changes in, or cash requirements for, our working capital needs;
• EBITDA does not reflect the interest expense or cash requirements necessary to service interest or
principal payments on our debt;
• although depreciation and amortization are non-cash charges, the assets being depreciated and amortized
will often have to be replaced in the future, and EBITDA does not reflect any cash requirements for such
replacements; and
• other companies in our industry may calculate EBITDA differently than we do, limiting its usefulness as
a comparative measure.
Because of these limitations, EBITDA should not be considered as a measure of discretionary cash available
to us to invest in the growth of our business and we rely primarily on our generally accepted accounting principles
results and use EBITDA only supplementally.
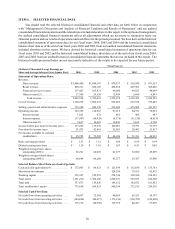
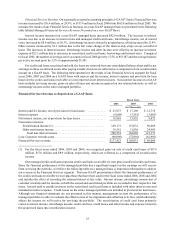
The following table reconciles EBITDA to net income:
Fiscal Year (1)
2006 2005 2004 2003 2002
(In Thousands)
Net income . . . . . . . . . . . . . . . . . . . . . . . . . $ 85,785 $ 72,569 $ 64,996 $ 51,391 $ 46,922
Deprecation and amortization . . . . . . . . 45,559 34,912 29,843 26,715 23,539
Interest income . . . . . . . . . . . . . . . . . . . . (1,821) (672) (601) (408) (443)
Interest expense . . . . . . . . . . . . . . . . . . . 17,947 10,928 8,178 11,158 8,413
Income taxes . . . . . . . . . . . . . . . . . . . . . 51,471 42,801 35,085 28,402 25,817
EBITDA . . . . . . . . . . . . . . . . . . . . . . . . . . . $198,941 $160,538 $137,501 $117,258 $104,248
(9) EBITDA margin is defined as our consolidated EBITDA as a percentage of our consolidated revenue.