Cabela's 2006 Annual Report Download - page 42
Download and view the complete annual report
Please find page 42 of the 2006 Cabela's annual report below. You can navigate through the pages in the report by either clicking on the pages listed below, or by using the keyword search tool below to find specific information within the annual report.-
 1
1 -
2
-
3
-
4
-
5
-
6
-
7
-
8
-
9
-
10
-
11
-
12
-
13
-
14
-
15
-
16
-
17
-
18
-
19
-
20
-
21
-
22
-
23
-
24
-
25
-
26
-
27
-
28
-
29
-
30
-
31
-
 32
32 -
 33
33 -
 34
34 -
 35
35 -
 36
36 -
 37
37 -
 38
38 -
 39
39 -
 40
40 -
 41
41 -
 42
42 -
 43
43 -
 44
44 -
 45
45 -
 46
46 -
 47
47 -
 48
48 -
 49
49 -
 50
50 -
 51
51 -
 52
52 -
53
-
54
-
55
-
56
-
57
-
58
-
59
-
60
-
61
-
62
-
63
-
64
-
65
-
66
-
67
-
68
-
69
-
70
-
71
-
72
-
73
-
74
-
75
-
76
-
77
-
78
-
79
-
80
-
81
-
82
-
83
-
84
-
85
-
86
-
87
-
88
-
89
-
90
-
91
-
92
-
93
-
94
-
95
-
96
-
97
-
98
-
99
-
100
-
101
-
102
-
103
-
104
-
105
-
106
-
107
-
108
-
109
-
110
-
111
-
112
-
113
-
114
 |
 |
38
Operating Income
Operating income increased by $28.7 million, or 25.0%, to $143.7 million in fiscal 2006 from $115.0 million in
fiscal 2005. Operating income as a percentage of revenue increased to 7.0% in fiscal 2006 from 6.4% in fiscal 2005.
Operating income from our Direct segment was flat at 16.5% in both fiscal 2006 and 2005. Our Retail segment
operating income improved to 15.1% from 13.9% as the continued expansion helps offset overhead costs and our
comparable store operating costs have improved with more efficient labor scheduling. Financial Services operating
income is up 0.1% to 21.9% from 21.8% as growth in our customer loyalty program continues to contribute positive
returns in this segment.
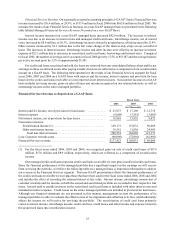
Other Income
Other income decreased by $1.0 million to $9.6 million in fiscal 2006 from $10.6 million in fiscal 2005 primarily
due to a decrease in interest earned from economic development bonds of $1.0 million in fiscal 2005. Economic
development bonds classified as “available-for-sale” on our balance sheet decreased by $27.5 million as we retired
more bonds than were purchased in the period.
Interest Expense
Interest expense increased by $7.0 million in fiscal 2006 to $17.9 million as compared with $10.9 million in
fiscal 2005. The interest expense increase was primarily due to the $215.0 million private placement of notes that
was completed in February of 2006. This was partially offset by an increase in interest income earned on invested
cash of $1.1 million in 2006.
Income Taxes
Our effective tax rate was 37.5% in fiscal 2006 compared to 37.1% in fiscal 2005. The increase in our effective
tax rate is primarily a result of us entering additional states during 2006. We expect that our effective tax rate will
continue to increase as we enter more states with our destination retail stores.
Fiscal Year 2005 Compared to Fiscal Year 2004
Revenue
Revenue increased by $243.7 million, or 15.7%, to $1,799.7 million in fiscal 2005 from $1,556.0 million in fiscal
2004 as we experienced revenue growth in each of our segments. We sold a significant amount of land in fiscal 2005
as compared to fiscal 2004, which was the primary contributor to the revenue growth in our Other segment of $17.1
million.
Direct Revenue. Direct revenue increased by $68.0 million, or 7.0%, to $1,044.2 million in fiscal 2005 from
$976.2 million in fiscal 2004 primarily due to growth in sales through our website. The number of customer packages
shipped increased by 8.0% to 9.9 million in fiscal 2005. Circulation of our catalogs increased by 0.8 billion pages,
or 2.3%, to 35.3 billion pages in fiscal 2005 from 34.5 billion pages in fiscal 2004. The number of active customers,
which we define as those customers who have purchased merchandise from us in the last twelve months, increased
by 4.8% to approximately 4.4 million in fiscal 2005 over fiscal 2004. The product categories that contributed the
largest dollar volume increase to our fiscal 2005 Direct revenue growth included hunting equipment, footwear and
camping.
Retail Revenue. Retail revenue increased by $121.8 million, or 24.5%, to $620.1 million in fiscal 2005 from
$498.3 million in fiscal 2004 due to increased new store sales of $154.9 million. Revenue for stores in our comparable
base decreased by $28.8 million, or 6.2%, compared to fiscal 2004. We attribute the decrease in comparable store
sales to the addition of our Hamburg, Pennsylvania store in the comparable store base, higher gasoline prices,
unemployment related to the industries near our Dundee, Michigan store and cannibalization of sales from our
Owatonna, Minnesota store related to the opening of our Rogers, Minnesota store. Our Hamburg store was very
successful in 2004 making comparable store sales challenging. Hurricanes in the southern part of the United States
may have had some impact on our two new stores in Texas; however the primary impact was the hurricanes’ effect
on gasoline prices. The product categories that contributed the largest dollar volume increase to our Retail revenue
growth in fiscal 2005 included hunting equipment, camping and footwear.