Cabela's 2006 Annual Report Download - page 65
Download and view the complete annual report
Please find page 65 of the 2006 Cabela's annual report below. You can navigate through the pages in the report by either clicking on the pages listed below, or by using the keyword search tool below to find specific information within the annual report.-
 1
1 -
2
-
3
-
4
-
5
-
6
-
7
-
8
-
9
-
10
-
11
-
12
-
13
-
14
-
15
-
16
-
17
-
18
-
19
-
20
-
21
-
22
-
23
-
24
-
25
-
26
-
27
-
28
-
29
-
30
-
31
-
32
-
33
-
34
-
35
-
36
-
37
-
38
-
39
-
40
-
41
-
42
-
43
-
44
-
45
-
46
-
47
-
48
-
49
-
50
-
51
-
52
-
53
-
54
-
 55
55 -
 56
56 -
 57
57 -
 58
58 -
 59
59 -
 60
60 -
 61
61 -
 62
62 -
 63
63 -
 64
64 -
 65
65 -
 66
66 -
 67
67 -
 68
68 -
 69
69 -
 70
70 -
 71
71 -
 72
72 -
 73
73 -
 74
74 -
 75
75 -
76
-
77
-
78
-
79
-
80
-
81
-
82
-
83
-
84
-
85
-
86
-
87
-
88
-
89
-
90
-
91
-
92
-
93
-
94
-
95
-
96
-
97
-
98
-
99
-
100
-
101
-
102
-
103
-
104
-
105
-
106
-
107
-
108
-
109
-
110
-
111
-
112
-
113
-
114
 |
 |

61
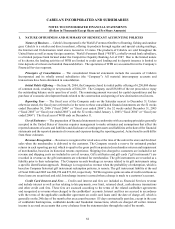
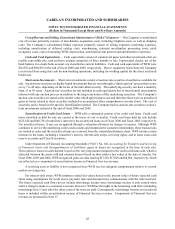
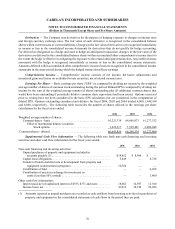
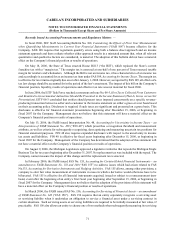
CABELA’S INCORPORATED AND SUBSIDIARIES
CONSOLIDATED STATEMENTS OF INCOME
(Dollars in Thousands Except Earnings Per Share)
Fiscal Years
2006 2005 2004
REVENUE:
Merchandise sales . . . . . . . . . . . . . . . . . . . . . . . . . . . . . . . . . $ 1,908,801 $ 1,664,272 $ 1,474,415
Financial services revenue........................... 137,423 105,831 69,060
Other revenue..................................... 17,300 29,558 12,499
Total revenue . . . . . . . . . . . . . . . . . . . . . . . . . . . . . . . . . . 2,063,524 1,799,661 1,555,974
COST OF REVENUE:
Cost of merchandise sales . . . . . . . . . . . . . . . . . . . . . . . . . . . 1,199,851 1,044,028 918,206
Cost of other revenue ............................... 4,548 20,294 7,459
Total cost of revenue (exclusive of depreciation and
amortization). . . . . . . . . . . . . . . . . . . . . . . . . . . . . . . . . . . 1,204,399 1,064,322 925,665
SELLING, GENERAL AND ADMINISTRATIVE
EXPENSES ...................................... 715,380 620,376 533,094
OPERATING INCOME ............................... 143,745 114,963 97,215
OTHER INCOME (EXPENSE):
Interest income.................................... 1,821 672 601
Interest expense . . . . . . . . . . . . . . . . . . . . . . . . . . . . . . . . . . . (17,947 ) (10,928 ) (8,178 )
Other income, net (Note 8) .......................... 9,637 10,663 10,443
Total other income (expense) . . . . . . . . . . . . . . . . . . . . . . (6,489) 407 2,866
INCOME BEFORE PROVISION FOR INCOME TAXES . . . . 137,256 115,370 100,081
PROVISION FOR INCOME TAXES (Note 9). . . . . . . . . . . . . . 51,471 42,801 35,085
NET INCOME....................................... $ 85,785 $ 72,569 $ 64,996
EARNINGS PER COMMON SHARE (Note 1):
Basic............................................ $ 1.32 $ 1.12 $ 1.06
Diluted .......................................... $ 1.29 $ 1.10 $ 1.03
WEIGHTED AVERAGE SHARES OUTSTANDING (Note 1):
Basic............................................ 65,221,339 64,668,973 61,277,352
Diluted .......................................... 66,643,856 66,268,374 63,277,400
See notes to consolidated financial statements.