Cabela's 2006 Annual Report Download - page 45
Download and view the complete annual report
Please find page 45 of the 2006 Cabela's annual report below. You can navigate through the pages in the report by either clicking on the pages listed below, or by using the keyword search tool below to find specific information within the annual report.-
 1
1 -
2
-
3
-
4
-
5
-
6
-
7
-
8
-
9
-
10
-
11
-
12
-
13
-
14
-
15
-
16
-
17
-
18
-
19
-
20
-
21
-
22
-
23
-
24
-
25
-
26
-
27
-
28
-
29
-
30
-
31
-
32
-
33
-
34
-
 35
35 -
 36
36 -
 37
37 -
 38
38 -
 39
39 -
 40
40 -
 41
41 -
 42
42 -
 43
43 -
 44
44 -
 45
45 -
 46
46 -
 47
47 -
 48
48 -
 49
49 -
 50
50 -
 51
51 -
 52
52 -
 53
53 -
 54
54 -
 55
55 -
56
-
57
-
58
-
59
-
60
-
61
-
62
-
63
-
64
-
65
-
66
-
67
-
68
-
69
-
70
-
71
-
72
-
73
-
74
-
75
-
76
-
77
-
78
-
79
-
80
-
81
-
82
-
83
-
84
-
85
-
86
-
87
-
88
-
89
-
90
-
91
-
92
-
93
-
94
-
95
-
96
-
97
-
98
-
99
-
100
-
101
-
102
-
103
-
104
-
105
-
106
-
107
-
108
-
109
-
110
-
111
-
112
-
113
-
114
 |
 |
41
•Financial Services selling, general and administrative expenses comprised $23.0 million of the total
increase in selling, general and administrative expense. This was primarily due to increased marketing
fees of $14.0 million allocated to our other segments. Advertising and promotion costs, including new
account acquisition costs, increased by $3.9 million due to increases in Visa assessments, new account
acquisition costs and account retention tools. Third-party data processing services increased by $1.8
million, as the number of credit card accounts and transactions increased. Salary and related benefits
increased $1.5 million with the growth of the bank. Professional fees increased $0.9 million due to
consulting services for industry data research. Bad debt expense increased by $0.7 million primarily due
to an increase in counterfeit fraud. Our bad debts relating to fraud are less than industry standards.
Operating Income
Operating income increased by $17.8 million, or 18.3%, to $115.0 million in fiscal 2005 from $97.2 million in
fiscal 2004 primarily due to the factors discussed above.
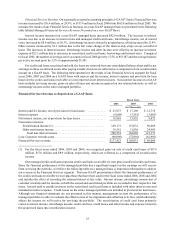
Other Income
Other income increased by $0.2 million to $10.6 million in fiscal 2005 from $10.4 million in fiscal 2004
primarily due to an increase in interest earned from economic development bonds of $3.5 million in fiscal 2005.
This increase was offset by decreases in gain on sale of investment and equity recognized for an unconsolidated
subsidiary of $3.3 million related to the sale of our investment in Great Wolf Lodge, LLC in fiscal 2004.
Interest Expense
Interest expense increased by $2.7 million in fiscal 2005 to $10.9 million as compared with $8.2 million in
fiscal 2004. The interest expense increase was primarily due to increased borrowings on our revolving line of credit.
In fiscal 2004, we were able to utilize the proceeds from our initial public offering rather than incurring interest on
our revolving line of credit.
Income Taxes
Our effective tax rate was 37.1% in fiscal 2005 compared to 35.1% in fiscal 2004. The increase in our effective
tax rate is a result of us entering additional states during 2005, changing our estimated rate on deferred taxes and
truing up our prior year’s tax provision. We expect that our effective tax rate will continue to increase as we enter
more states with our destination retail stores.
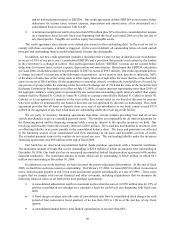
Quarterly Results of Operations for Fiscal Years 2006 and 2005 and Seasonal Influences
Due to holiday buying patterns and hunting and fishing season openings across the country, merchandise
revenue is typically higher in the third and fourth quarters than in the first and second quarters. We anticipate our
revenue will continue to be seasonal in nature.
The following table sets forth unaudited financial and operating data in each quarter during fiscal years 2006
and 2005. This quarterly information has been prepared on a basis consistent with our audited financial statements
and includes all normal recurring adjustments that we consider necessary for a fair presentation of the information
shown. This information should be read in conjunction with our selected financial data and audited consolidated
financial statements and the notes thereto appearing elsewhere in this report. Our quarterly operating results may
fluctuate significantly as a result of these and a variety of other factors, and operating results for any quarter are not
necessarily indicative of results for a full fiscal year. See “Risk Factors.”