Google 2015 Annual Report Download - page 100
Download and view the complete annual report
Please find page 100 of the 2015 Google annual report below. You can navigate through the pages in the report by either clicking on the pages listed below, or by using the keyword search tool below to find specific information within the annual report.-
 1
1 -
2
-
3
-
4
-
5
-
6
-
7
-
8
-
9
-
10
-
11
-
12
-
13
-
14
-
15
-
16
-
17
-
18
-
19
-
20
-
21
-
22
-
23
-
24
-
25
-
26
-
27
-
28
-
29
-
30
-
31
-
32
-
33
-
34
-
35
-
36
-
37
-
38
-
39
-
40
-
41
-
42
-
43
-
44
-
45
-
46
-
47
-
48
-
49
-
50
-
51
-
52
-
53
-
54
-
55
-
56
-
57
-
58
-
59
-
60
-
61
-
62
-
63
-
64
-
65
-
66
-
67
-
68
-
69
-
70
-
71
-
72
-
73
-
74
-
75
-
76
-
77
-
78
-
79
-
80
-
81
-
82
-
83
-
84
-
85
-
86
-
87
-
88
-
89
-
 90
90 -
 91
91 -
 92
92 -
 93
93 -
 94
94 -
 95
95 -
 96
96 -
 97
97 -
 98
98 -
 99
99 -
 100
100 -
 101
101 -
 102
102 -
 103
103 -
 104
104 -
 105
105 -
 106
106 -
 107
107 -
 108
108 -
 109
109 -
 110
110 -
111
-
112
-
113
-
114
-
115
-
116
-
117
-
118
-
119
-
120
-
121
-
122
-
123
-
124
-
125
-
126
-
127
 |
 |
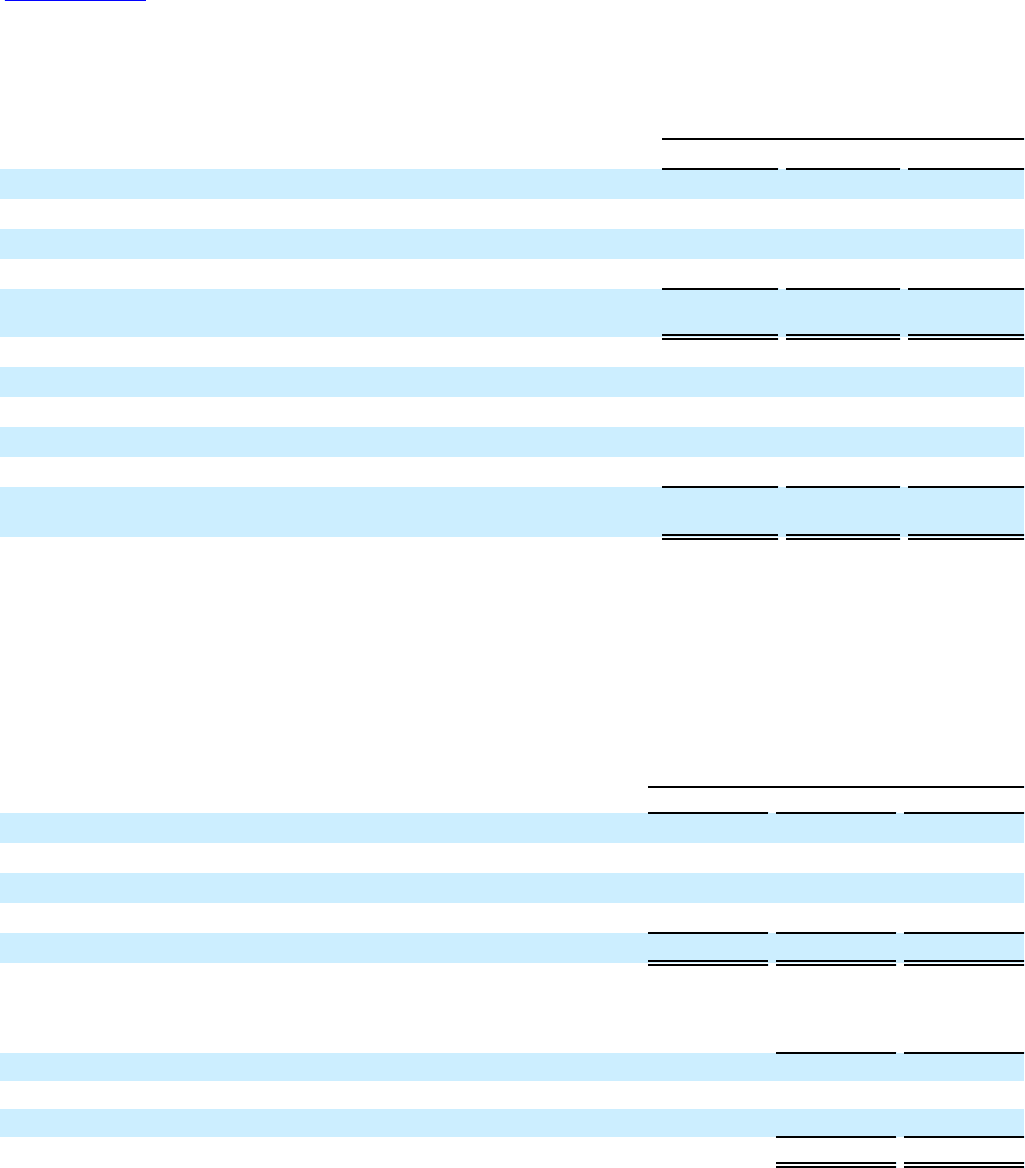
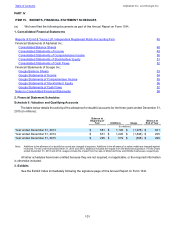
Table of Contents Alphabet Inc. and Google Inc.
96
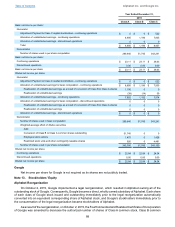
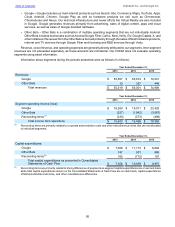
Stock-based compensation and depreciation, amortization and impairment are included in segment operating
income (loss) as below (in millions):
Year Ended December 31,
2013 2014 2015
Stock-based compensation:
Google $ 2,911 $ 3,677 $ 4,587
Other Bets 124 347 498
Reconciling items(3) 92 151 118
Total stock based compensation, excluding discontinued
operations(4) $ 3,127 $ 4,175 $ 5,203
Depreciation, amortization and impairment:
Google $ 3,668 $ 4,778 $ 4,839
Other Bets 24 148 203
Reconciling items(5) 247 53 21
Total depreciation, amortization and impairment as presented
in Consolidated Statements of Cash Flow $ 3,939 $ 4,979 $ 5,063
(3) Reconciling items represent corporate administrative costs that are not allocated to individual segments.
(4) For purposes of segment reporting, we define SBC as awards accounted for under FASB ASC Topic 718 that we expect to
settle in stock. SBC does not include expenses related to awards that we will ultimately settle in cash. Amounts exclude SBC
from discontinued operations.
(5) Reconciling items primarily represent depreciation, amortization and impairment related to Motorola Mobile and Motorola
Home.
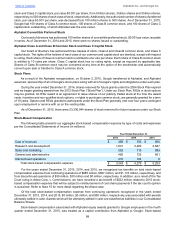
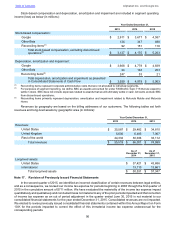
Revenues by geography are based on the billing addresses of our customers. The following tables set forth
revenues and long-lived assets by geographic area (in millions):
Year Ended December 31,
2013 2014 2015
Revenues:
United States $ 25,587 $ 29,482 $ 34,810
United Kingdom 5,600 6,483 7,067
Rest of the world 24,332 30,036 33,112
Total revenues $ 55,519 $ 66,001 $ 74,989
As of
December 31,
2014
As of
December 31,
2015
Long-lived assets:
United States $ 37,421 $ 43,686
International 13,110 13,661
Total long-lived assets $ 50,531 $ 57,347
Note 17. Revision of Previously Issued Financial Statements
In the second quarter of 2015, we identified an incorrect classification of certain revenues between legal entities,
and as a consequence, we revised our income tax expense for periods beginning in 2008 through the first quarter of
2015 in the cumulative amount of $711 million. We have evaluated the materiality of the income tax expense impact
quantitatively and qualitatively and concluded it was not material to any of the prior periods impacted and that correction
of income tax expense as an out of period adjustment in the quarter ended June 30, 2015 is not material to our
consolidated financial statements for the year ended December 31, 2015. Consolidated revenues are not impacted.
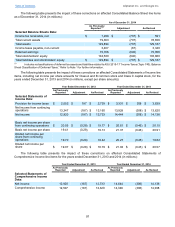
We elected to revise previously issued consolidated financial statements contained within this Annual Report on Form
10-K for the periods impacted to correct the effect of this immaterial income tax expense underaccrual for the
corresponding periods.