Google 2015 Annual Report Download - page 41
Download and view the complete annual report
Please find page 41 of the 2015 Google annual report below. You can navigate through the pages in the report by either clicking on the pages listed below, or by using the keyword search tool below to find specific information within the annual report.-
 1
1 -
2
-
3
-
4
-
5
-
6
-
7
-
8
-
9
-
10
-
11
-
12
-
13
-
14
-
15
-
16
-
17
-
18
-
19
-
20
-
21
-
22
-
23
-
24
-
25
-
26
-
27
-
28
-
29
-
30
-
 31
31 -
 32
32 -
 33
33 -
 34
34 -
 35
35 -
 36
36 -
 37
37 -
 38
38 -
 39
39 -
 40
40 -
 41
41 -
 42
42 -
 43
43 -
 44
44 -
 45
45 -
 46
46 -
 47
47 -
 48
48 -
 49
49 -
 50
50 -
 51
51 -
52
-
53
-
54
-
55
-
56
-
57
-
58
-
59
-
60
-
61
-
62
-
63
-
64
-
65
-
66
-
67
-
68
-
69
-
70
-
71
-
72
-
73
-
74
-
75
-
76
-
77
-
78
-
79
-
80
-
81
-
82
-
83
-
84
-
85
-
86
-
87
-
88
-
89
-
90
-
91
-
92
-
93
-
94
-
95
-
96
-
97
-
98
-
99
-
100
-
101
-
102
-
103
-
104
-
105
-
106
-
107
-
108
-
109
-
110
-
111
-
112
-
113
-
114
-
115
-
116
-
117
-
118
-
119
-
120
-
121
-
122
-
123
-
124
-
125
-
126
-
127
 |
 |

Table of Contents Alphabet Inc. and Google Inc.
37
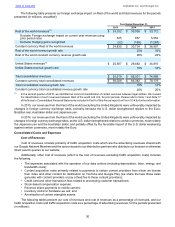
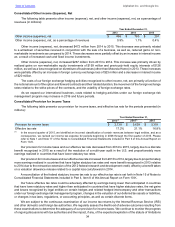
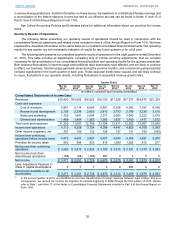
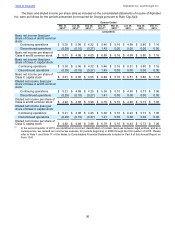
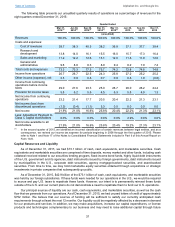
The following table presents our unaudited quarterly results of operations as a percentage of revenues for the
eight quarters ended December 31, 2015:
Quarter Ended
Mar 31,
2014(1) Jun 30,
2014(1) Sep 30,
2014(1) Dec 31,
2014(1) Mar 31,
2015(1) Jun 30,
2015 Sep 30,
2015 Dec 31,
2015
(unaudited)
Revenues 100.0% 100.0% 100.0% 100.0% 100.0% 100.0% 100.0% 100.0%
Costs and expenses:
Cost of revenues 38.7 38.3 40.5 38.2 36.8 37.1 37.7 38.4
Research and
development 13.8 14.0 16.1 15.5 16.0 15.7 17.3 16.4
Sales and marketing 11.2 12.2 12.6 13.1 12.0 11.8 11.9 12.6
General and
administrative 9.6 8.8 8.3 8.9 9.4 8.2 7.9 7.4
Total costs and expenses 73.3 73.3 77.5 75.7 74.2 72.8 74.8 74.8
Income from operations 26.7 26.7 22.5 24.3 25.8 27.2 25.2 25.2
Other income (expense), net 2.3 0.9 0.8 0.7 0.9 0.8 1.0 (0.8)
Income from continuing
operations before income
taxes 29.0 27.6 23.3 25.0 26.7 28.0 26.2 24.4
Provision for income taxes 5.8 6.2 5.6 4.5 6.3 5.8 4.9 1.3
Net income from continuing
operations 23.2 21.4 17.7 20.5 20.4 22.2 21.3 23.1
Net income (loss) from
discontinued operations (1.3) (0.4) (1.1) 5.3 0.0 0.0 0.0 0.0
Net income 21.9% 21.0% 16.6% 25.8% 20.4% 22.2% 21.3% 23.1%
Less: Adjustment Payment to
Class C capital stockholders 0.0% 0.0% 0.0% 0.0% 0.0% 2.9% 0.0% 0.0%
Net income available to all
stockholders 21.9% 21.0% 16.6% 25.8% 20.4% 19.2% 21.3% 23.1%
(1) In the second quarter of 2015, we identified an incorrect classification of certain revenues between legal entities, and as a
consequence, we revised our income tax expense for periods beginning in 2008 through the first quarter of 2015. Please
refer to Note 1 and Note 17 of the Notes to Consolidated Financial Statements included in Part II of this Annual Report on
Form 10-K.
Capital Resources and Liquidity
As of December 31, 2015, we had $73.1 billion of cash, cash equivalents, and marketable securities. Cash
equivalents and marketable securities are comprised of time deposits, money market and other funds, including cash
collateral received related to our securities lending program, fixed-income bond funds, highly liquid debt instruments
of the U.S. government and its agencies, debt instruments issued by foreign governments, debt instruments issued
by municipalities in the U.S., corporate debt securities, agency mortgage-backed securities, and asset-backed
securities. From time to time, we may hold marketable equity securities obtained through acquisitions or strategic
investments in private companies that subsequently go public.
As of December 31, 2015, $42.9 billion of the $73.1 billion of cash, cash equivalents, and marketable securities
was held by our foreign subsidiaries. If these funds were needed for our operations in the U.S., we would be required
to accrue and pay U.S. taxes to repatriate these funds. However, our intent is to permanently reinvest these funds
outside of the U.S. and our current plans do not demonstrate a need to repatriate them to fund our U.S. operations.
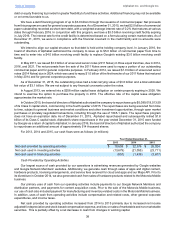
Our principal sources of liquidity are our cash, cash equivalents, and marketable securities, as well as the cash
flow that we generate from our operations. As of December 31, 2015, we had unused letters of credit of approximately
$752 million. We believe that our sources of funding will be sufficient to satisfy our currently anticipated cash
requirements through at least the next 12 months. Our liquidity could be negatively affected by a decrease in demand
for our products and services. In addition, we may make acquisitions, increase our capital expenditures, or license
products and technologies complementary to our business and may need to raise additional capital through future