Google 2015 Annual Report Download - page 31
Download and view the complete annual report
Please find page 31 of the 2015 Google annual report below. You can navigate through the pages in the report by either clicking on the pages listed below, or by using the keyword search tool below to find specific information within the annual report.-
 1
1 -
2
-
3
-
4
-
5
-
6
-
7
-
8
-
9
-
10
-
11
-
12
-
13
-
14
-
15
-
16
-
17
-
18
-
19
-
20
-
 21
21 -
 22
22 -
 23
23 -
 24
24 -
 25
25 -
 26
26 -
 27
27 -
 28
28 -
 29
29 -
 30
30 -
 31
31 -
 32
32 -
 33
33 -
 34
34 -
 35
35 -
 36
36 -
 37
37 -
 38
38 -
 39
39 -
 40
40 -
 41
41 -
42
-
43
-
44
-
45
-
46
-
47
-
48
-
49
-
50
-
51
-
52
-
53
-
54
-
55
-
56
-
57
-
58
-
59
-
60
-
61
-
62
-
63
-
64
-
65
-
66
-
67
-
68
-
69
-
70
-
71
-
72
-
73
-
74
-
75
-
76
-
77
-
78
-
79
-
80
-
81
-
82
-
83
-
84
-
85
-
86
-
87
-
88
-
89
-
90
-
91
-
92
-
93
-
94
-
95
-
96
-
97
-
98
-
99
-
100
-
101
-
102
-
103
-
104
-
105
-
106
-
107
-
108
-
109
-
110
-
111
-
112
-
113
-
114
-
115
-
116
-
117
-
118
-
119
-
120
-
121
-
122
-
123
-
124
-
125
-
126
-
127
 |
 |

Table of Contents Alphabet Inc. and Google Inc.
27
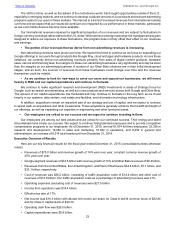
The increase in the number of paid clicks generated through our advertising programs from 2013 to 2014 was
due to certain monetization improvements including new and richer ad formats, an increase in aggregate traffic across
all platforms, the continued global expansion of our products, advertisers, and user base, partially offset by certain
advertising policy changes. The positive impact on our revenues from paid clicks was partially offset by a decrease in
the average cost-per-click paid by our advertisers. The decrease was due to various factors, such as the geographic
mix, device mix, property mix, ongoing product and policy changes, and the general strengthening of the U.S. dollar
compared to certain foreign currencies.
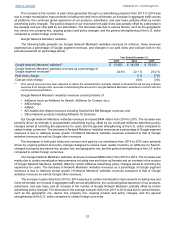
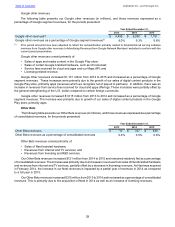
Google Network Members' websites
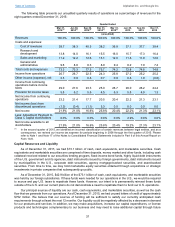
The following table presents our Google Network Members' websites revenues (in millions), those revenues
expressed as a percentage of Google segment revenues, and changes in our paid clicks and cost-per-click for the
periods presented (in percentage terms):
Year Ended December 31,
2013 2014 2015
Google Network Members' websites(1) $ 13,650 $ 14,539 $ 15,033
Google Network Members' websites revenues as a percentage of
Google segment revenues(1) 24.6% 22.1 % 20.2 %
Paid clicks change 2 % (7)%
Cost-per-click change (6)% (3)%
(1) Prior period amounts have been adjusted to reflect the reclassification primarily related to DoubleClick ad serving software
revenues from Google other revenues to Advertising Revenues from Google Network Members' websites to conform with the
current period presentation.
Google Network Members' websites revenues consist primarily of:
• AdSense (such as AdSense for Search, AdSense for Content, etc.);
• AdExchange;
• AdMob;
• All DoubleClick-related revenues including DoubleClick Bid Manager revenues; and
• Other Network products including AdSense for Domains.
Our Google Network Members' websites revenues increased $494 million from 2014 to 2015. The increase was
primarily driven by strength in programmatic advertising buying, offset by our continued AdSense advertising policy
changes aimed at enriching the experience for users and the general strengthening of the U.S. dollar compared to
certain foreign currencies. The decrease in Network Members' websites revenues as a percentage of Google segment
revenues is due to relatively slower growth of Network Members' websites revenues compared to that of Google
websites revenues as well as Google other revenues.
The decreases in both paid clicks and cost-per-click paid by our advertisers from 2014 to 2015 were primarily
driven by ongoing product and policy changes designed to reduce lower quality inventory on AdSense for Search,
changes in property and device mix, product mix, and geographic mix, and the general strengthening of the U.S. dollar
compared to certain foreign currencies.
Our Google Network Members' websites revenues increased $889 million from 2013 to 2014. The increase was
mainly due to certain monetization improvements including new and richer ad formats and an increase in the number
of Google Network Members, partially offset by certain AdSense advertising policy changes aimed at enriching the
experience for users. The decrease in Network Members' websites revenues as a percentage of Google segment
revenues is due to relatively slower growth of Network Members' websites revenues compared to that of Google
websites revenues as well as Google other revenues.
The increase in paid clicks from 2013 to 2014 was due to certain monetization improvements including new and
richer ad formats, an increase in aggregate traffic across all platforms, the continued global expansion of our products,
advertisers, and user base, and an increase in the number of Google Network Members, partially offset by certain
advertising policy changes. The decrease in the average cost-per-click from 2013 to 2014 was due to various factors,
such as the geographic mix, device mix, property mix, ongoing product and policy changes, and the general
strengthening of the U.S. dollar compared to certain foreign currencies.