Google 2015 Annual Report Download - page 37
Download and view the complete annual report
Please find page 37 of the 2015 Google annual report below. You can navigate through the pages in the report by either clicking on the pages listed below, or by using the keyword search tool below to find specific information within the annual report.-
 1
1 -
2
-
3
-
4
-
5
-
6
-
7
-
8
-
9
-
10
-
11
-
12
-
13
-
14
-
15
-
16
-
17
-
18
-
19
-
20
-
21
-
22
-
23
-
24
-
25
-
26
-
 27
27 -
 28
28 -
 29
29 -
 30
30 -
 31
31 -
 32
32 -
 33
33 -
 34
34 -
 35
35 -
 36
36 -
 37
37 -
 38
38 -
 39
39 -
 40
40 -
 41
41 -
 42
42 -
 43
43 -
 44
44 -
 45
45 -
 46
46 -
 47
47 -
48
-
49
-
50
-
51
-
52
-
53
-
54
-
55
-
56
-
57
-
58
-
59
-
60
-
61
-
62
-
63
-
64
-
65
-
66
-
67
-
68
-
69
-
70
-
71
-
72
-
73
-
74
-
75
-
76
-
77
-
78
-
79
-
80
-
81
-
82
-
83
-
84
-
85
-
86
-
87
-
88
-
89
-
90
-
91
-
92
-
93
-
94
-
95
-
96
-
97
-
98
-
99
-
100
-
101
-
102
-
103
-
104
-
105
-
106
-
107
-
108
-
109
-
110
-
111
-
112
-
113
-
114
-
115
-
116
-
117
-
118
-
119
-
120
-
121
-
122
-
123
-
124
-
125
-
126
-
127
 |
 |

Table of Contents Alphabet Inc. and Google Inc.
33
We expect that sales and marketing expenses will increase in dollar amount and may fluctuate as a percentage
of revenues in 2016 and future periods.
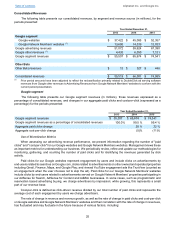
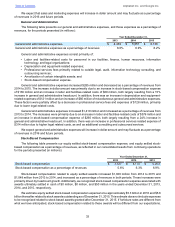
General and Administrative
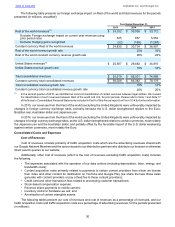
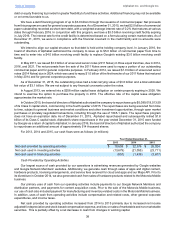
The following table presents our general and administrative expenses, and those expenses as a percentage of
revenues, for the periods presented (in millions):
Year Ended December 31,
2013 2014 2015
General and administrative expenses $ 4,432 $ 5,851 $ 6,136
General and administrative expenses as a percentage of revenues 8.0% 8.9% 8.2%
General and administrative expenses consist primarily of:
• Labor and facilities-related costs for personnel in our facilities, finance, human resources, information
technology, and legal organizations;
• Depreciation and equipment-related expenses;
• Professional services fees primarily related to outside legal, audit, information technology consulting, and
outsourcing services;
• Amortization of certain intangible assets; and
• Stock-based compensation expense.
General and administrative expenses increased $285 million and decreased as a percentage of revenues from
2014 to 2015. The increase in dollar amount was primarily due to an increase in stock-based compensation expense
of $136 million and an increase in labor and facilities-related costs of $69 million, both largely resulting from a 15%
increase in general and administrative headcount. In addition, there was an increase in depreciation and equipment-
related expenses of $121 million and an increase of $80 million of miscellaneous general and administrative expenses.
These factors were partially offset by a decrease in professional service fees and expenses of $128 million, primarily
due to lower legal-related costs.
General and administrative expenses increased $1,419 million and increased as a percentage of revenues from
2013 to 2014. The increases were primarily due to an increase in labor and facilities-related costs of $576 million and
an increase in stock-based compensation expense of $260 million, both largely resulting from a 24% increase in
general and administrative headcount. In addition, there was an increase in professional services related expense of
$314 million due to higher legal related costs, as well as additional consulting and outsourced services.
We expect general and administrative expenses will increase in dollar amount and may fluctuate as a percentage
of revenues in 2016 and future periods.
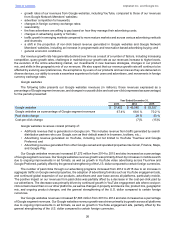
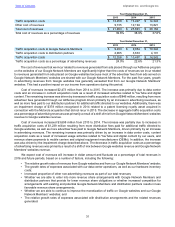
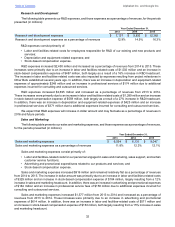
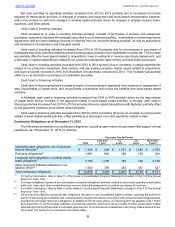
Stock-Based Compensation
The following table presents our equity settled stock-based compensation expense, and equity settled stock-
based compensation as a percentage of revenues, as reflected in our consolidated results from continuing operations
for the periods presented (in millions):
Year Ended December 31,
2013 2014 2015
Stock-based compensation $ 3,127 $ 4,175 $ 5,203
Stock-based compensation as a percentage of revenues 5.6% 6.3% 6.9%
Stock-based compensation related to equity settled awards increased $1,028 million from 2014 to 2015 and
$1,048 million from 2013 to 2014, and increased as a percentage of revenues in both periods. These increases were
primarily driven by headcount growth. Additionally, we recognized stock-based compensation expense associated with
awards ultimately settled in cash of $0 million, $0 million, and $50 million in the years ended December 31, 2013,
2014, and 2015, respectively.
We estimate equity settled stock-based compensation expense to be approximately $5.3 billion in 2016 and $5.8
billion thereafter related to stock awards outstanding as of December 31, 2015. This estimate does not include expenses
to be recognized related to stock-based awards granted after December 31, 2015. If forfeiture rates are different from
what we have anticipated, stock-based compensation related to these awards will be different from our expectations.