Google 2015 Annual Report Download - page 43
Download and view the complete annual report
Please find page 43 of the 2015 Google annual report below. You can navigate through the pages in the report by either clicking on the pages listed below, or by using the keyword search tool below to find specific information within the annual report.-
 1
1 -
2
-
3
-
4
-
5
-
6
-
7
-
8
-
9
-
10
-
11
-
12
-
13
-
14
-
15
-
16
-
17
-
18
-
19
-
20
-
21
-
22
-
23
-
24
-
25
-
26
-
27
-
28
-
29
-
30
-
31
-
32
-
 33
33 -
 34
34 -
 35
35 -
 36
36 -
 37
37 -
 38
38 -
 39
39 -
 40
40 -
 41
41 -
 42
42 -
 43
43 -
 44
44 -
 45
45 -
 46
46 -
 47
47 -
 48
48 -
 49
49 -
 50
50 -
 51
51 -
 52
52 -
 53
53 -
54
-
55
-
56
-
57
-
58
-
59
-
60
-
61
-
62
-
63
-
64
-
65
-
66
-
67
-
68
-
69
-
70
-
71
-
72
-
73
-
74
-
75
-
76
-
77
-
78
-
79
-
80
-
81
-
82
-
83
-
84
-
85
-
86
-
87
-
88
-
89
-
90
-
91
-
92
-
93
-
94
-
95
-
96
-
97
-
98
-
99
-
100
-
101
-
102
-
103
-
104
-
105
-
106
-
107
-
108
-
109
-
110
-
111
-
112
-
113
-
114
-
115
-
116
-
117
-
118
-
119
-
120
-
121
-
122
-
123
-
124
-
125
-
126
-
127
 |
 |
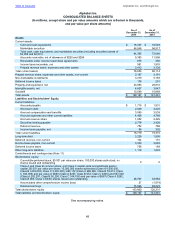
Table of Contents Alphabet Inc. and Google Inc.
39
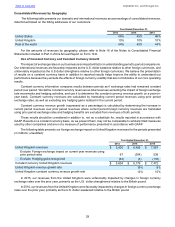
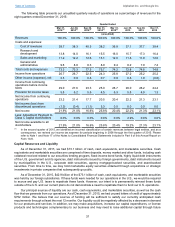
Net cash provided by operating activities increased from 2013 to 2014 primarily due to increased net income
adjusted for depreciation and loss on disposal of property and equipment and stock-based compensation expense,
and a net increase in cash from changes in working capital primarily driven by changes in prepaid revenue share,
expenses, and other assets.
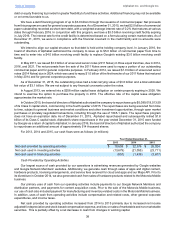
Cash Used in Investing Activities
Cash provided by or used in investing activities primarily consists of purchases of property and equipment,
purchases, maturities, and sales of marketable securities in our investment portfolio, investments in reverse repurchase
agreements and the cash collateral received or returned from our securities lending program, as well as acquisitions
and divestitures of businesses and intangible assets.
Cash used in investing activities increased from 2014 to 2015 primarily due to net increases in purchases of
marketable securities, activities related to security lending and purchases of non-marketable investments. This increase
was partially offset by lower spend related to acquisitions, lower investments in reverse repurchase agreements, and
a decrease in capital expenditures related to our production equipment, data centers, and real estate purchases.
Cash used in investing activities increased from 2013 to 2014 primarily due to increases in capital expenditures
related to our production equipment, data centers, and real estate purchases, higher spend related to acquisitions,
and lower proceeds received in 2014 from divestiture of businesses compared to 2013. This increase was partially
offset by a net decrease in purchases of marketable securities.
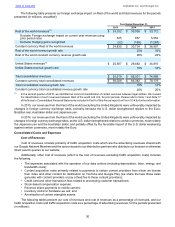
Cash Used in Financing Activities
Cash used in financing activities consists primarily of net proceeds or payments from issuance or repayments of
debt, repurchases of capital stock, and net proceeds or payments and excess tax benefits from stock-based award
activities.
In Alphabet, cash used in financing activities increased from 2014 to 2015 primarily driven by the repurchases
of capital stock and an increase in net payments related to stock-based award activities. In Google, cash used in
financing activities increased from 2014 to 2015 is primarily driven by capital transactions with Alphabet, partially offset
by net payments related to stock-based award activities.
Cash used in financing activities increased from 2013 to 2014 is primarily driven by an increase in net payments
related to stock-based award activities, offset partially by a decrease in net cash payments related to debt.
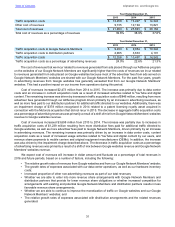
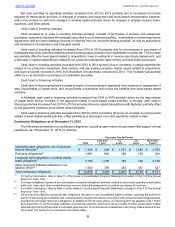
Contractual Obligations as of December 31, 2015
The following summarizes our contractual obligations, excluding open orders for purchases that support normal
operations, as of December 31, 2015 (in millions):
Payments Due By Period
Total Less than
1 year 1-3
years 3-5
years More than
5 years
Operating lease obligations, net of sublease
income amounts(1) $ 7,406 $ 646 $ 1,573 $ 1,482 $ 3,705
Purchase obligations(2) 1,697 946 298 150 303
Long-term debt obligations, including capital
lease obligations(3) 3,722 1,306 140 140 2,136
Other long-term liabilities reflected on our
balance sheet(4) 1,580 356 430 367 427
Total contractual obligations $ 14,405 $ 3,254 $ 2,441 $ 2,139 $ 6,571
(1) For further information, refer to Note 11 of the Notes to Consolidated Financial Statements included in Part II of this Annual
Report on Form 10-K.
(2) Purchase obligations represent non-cancelable contractual obligations primarily related to data center operations and facility
build-outs, video and other content licensing revenue sharing arrangements, as well as purchases of inventory.
(3) For further information, refer to Note 4 of the Notes to Consolidated Financial Statements included in Part II of this Annual
Report on Form 10-K.
(4) Other long-term liabilities represent cash obligations recorded on our consolidated balance sheets, including the short-term
portion of these long-term liabilities and consist primarily of payments owed in connection with certain commercial agreements,
investments and asset retirement obligations. In addition to the amounts above, we had long-term tax payable of $3.7 billion
as of December 31, 2015 primarily related to uncertain tax positions. At this time, we are unable to make a reasonably reliable
estimate of the timing of payments in individual years beyond 12 months due to uncertainties in the timing of tax audit outcomes.
As a result, this amount is not included in the above table.