Google 2015 Annual Report Download - page 35
Download and view the complete annual report
Please find page 35 of the 2015 Google annual report below. You can navigate through the pages in the report by either clicking on the pages listed below, or by using the keyword search tool below to find specific information within the annual report.-
 1
1 -
2
-
3
-
4
-
5
-
6
-
7
-
8
-
9
-
10
-
11
-
12
-
13
-
14
-
15
-
16
-
17
-
18
-
19
-
20
-
21
-
22
-
23
-
24
-
 25
25 -
 26
26 -
 27
27 -
 28
28 -
 29
29 -
 30
30 -
 31
31 -
 32
32 -
 33
33 -
 34
34 -
 35
35 -
 36
36 -
 37
37 -
 38
38 -
 39
39 -
 40
40 -
 41
41 -
 42
42 -
 43
43 -
 44
44 -
 45
45 -
46
-
47
-
48
-
49
-
50
-
51
-
52
-
53
-
54
-
55
-
56
-
57
-
58
-
59
-
60
-
61
-
62
-
63
-
64
-
65
-
66
-
67
-
68
-
69
-
70
-
71
-
72
-
73
-
74
-
75
-
76
-
77
-
78
-
79
-
80
-
81
-
82
-
83
-
84
-
85
-
86
-
87
-
88
-
89
-
90
-
91
-
92
-
93
-
94
-
95
-
96
-
97
-
98
-
99
-
100
-
101
-
102
-
103
-
104
-
105
-
106
-
107
-
108
-
109
-
110
-
111
-
112
-
113
-
114
-
115
-
116
-
117
-
118
-
119
-
120
-
121
-
122
-
123
-
124
-
125
-
126
-
127
 |
 |
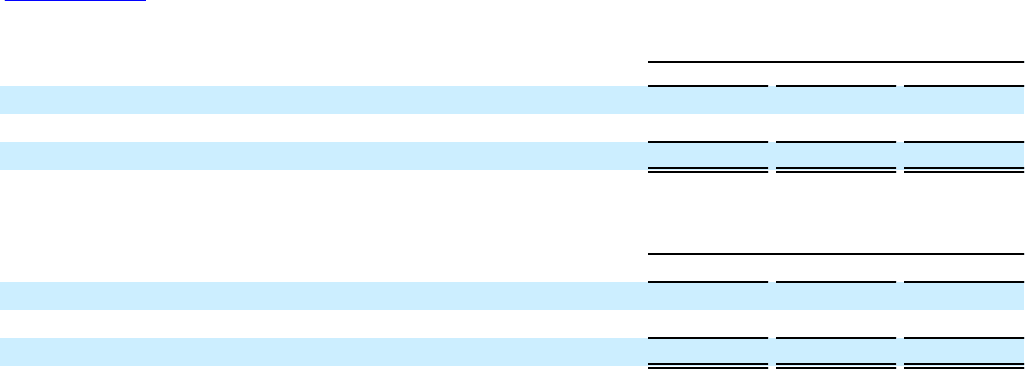
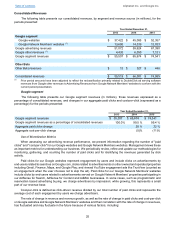
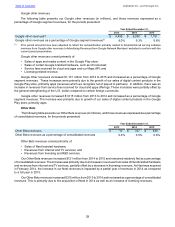
Table of Contents Alphabet Inc. and Google Inc.
31
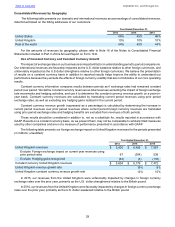
Year Ended December 31,
2013 2014 2015
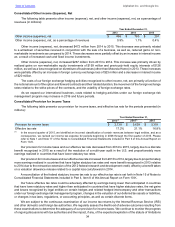
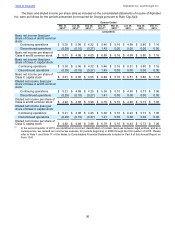
Traffic acquisition costs $ 12,258 $ 13,497 $ 14,343
Other cost of revenues 9,735 12,194 13,821
Total cost of revenues $ 21,993 $ 25,691 $ 28,164
Total cost of revenues as a percentage of revenues 39.6% 38.9% 37.6%
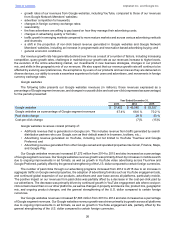
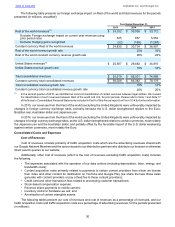
Year Ended December 31,
2013 2014 2015
Traffic acquisition costs to Google Network Members $ 9,293 $ 9,864 $ 10,242
Traffic acquisition costs to distribution partners 2,965 3,633 4,101
Traffic acquisition costs $ 12,258 $ 13,497 $ 14,343
Traffic acquisition costs as a percentage of advertising revenues 24.0% 22.6% 21.3%
The cost of revenues that we incur related to revenues generated from ads placed through our AdSense program
on the websites of our Google Network Members are significantly higher than the costs of revenues we incur related
to revenues generated from ads placed on Google websites because most of the advertiser fees from ads served on
Google Network Members’ websites are shared with our Google Network Members. For the past five years, growth
in advertising revenues from Google websites has generally exceeded that from our Google Network Members’
websites. This had a positive impact on our income from operations during this period.
Cost of revenues increased $2,473 million from 2014 to 2015. The increase was primarily due to data center
costs and an increase in content acquisition costs as a result of increased activities related to YouTube and digital
content. The remaining increase was driven by increases in traffic acquisition costs of $846 million, resulting from more
advertiser fees generated through our AdSense program driven primarily by an increase in advertising revenues, as
well as more fees paid to our distribution partners for additional traffic directed to our websites. Additionally, there was
an impairment charge of $378 million recognized in 2014 related to a patent licensing royalty asset acquired in
connection with the Motorola acquisition that did not recur in 2015. The decrease in aggregate traffic acquisition costs
as a percentage of advertising revenues was primarily a result of a shift of mix from Google Network Members' websites
revenue to Google websites revenue.
Cost of revenues increased $3,698 million from 2013 to 2014. The increase was partially due to increases in
traffic acquisition costs of $1,239 million resulting from more distribution fees paid for additional traffic directed to
Google websites, as well as more advertiser fees paid to Google Network Members, driven primarily by an increase
in advertising revenues. The remaining increase was primarily driven by an increase in data center costs, content
acquisition costs as a result of increased usage activities related to YouTube and digital content by our users, and
revenue share payments to mobile carriers and original equipment manufacturers (OEMs). In addition, the increase
was also driven by the impairment charge described above. The decrease in traffic acquisition costs as a percentage
of advertising revenues was primarily a result of a shift of mix between Google websites revenue and Google Network
Members' websites revenue.
We expect cost of revenues will increase in dollar amount and fluctuate as a percentage of total revenues in
2016 and future periods, based on a number of factors, including the following:
• The relative growth rates of revenues from Google websites and from our Google Network Members' website;
• The growth rates of expenses associated with our data center operations, as well as our hardware inventory
costs;
• Increased proportion of other non-advertising revenues as part of our total revenues;
• Whether we are able to enter into more revenue share arrangements with Google Network Members and
distribution partners that provide for lower revenue share obligations or whether increased competition for
arrangements with existing and potential Google Network Members and distribution partners results in less
favorable revenue share arrangements;
• Whether we are able to continue to improve the monetization of traffic on Google websites and our Google
Network Members' websites; and
• The relative growth rates of expenses associated with distribution arrangements and the related revenues
generated.