Google 2015 Annual Report Download - page 76
Download and view the complete annual report
Please find page 76 of the 2015 Google annual report below. You can navigate through the pages in the report by either clicking on the pages listed below, or by using the keyword search tool below to find specific information within the annual report.-
 1
1 -
2
-
3
-
4
-
5
-
6
-
7
-
8
-
9
-
10
-
11
-
12
-
13
-
14
-
15
-
16
-
17
-
18
-
19
-
20
-
21
-
22
-
23
-
24
-
25
-
26
-
27
-
28
-
29
-
30
-
31
-
32
-
33
-
34
-
35
-
36
-
37
-
38
-
39
-
40
-
41
-
42
-
43
-
44
-
45
-
46
-
47
-
48
-
49
-
50
-
51
-
52
-
53
-
54
-
55
-
56
-
57
-
58
-
59
-
60
-
61
-
62
-
63
-
64
-
65
-
 66
66 -
 67
67 -
 68
68 -
 69
69 -
 70
70 -
 71
71 -
 72
72 -
 73
73 -
 74
74 -
 75
75 -
 76
76 -
 77
77 -
 78
78 -
 79
79 -
 80
80 -
 81
81 -
 82
82 -
 83
83 -
 84
84 -
 85
85 -
 86
86 -
87
-
88
-
89
-
90
-
91
-
92
-
93
-
94
-
95
-
96
-
97
-
98
-
99
-
100
-
101
-
102
-
103
-
104
-
105
-
106
-
107
-
108
-
109
-
110
-
111
-
112
-
113
-
114
-
115
-
116
-
117
-
118
-
119
-
120
-
121
-
122
-
123
-
124
-
125
-
126
-
127
 |
 |
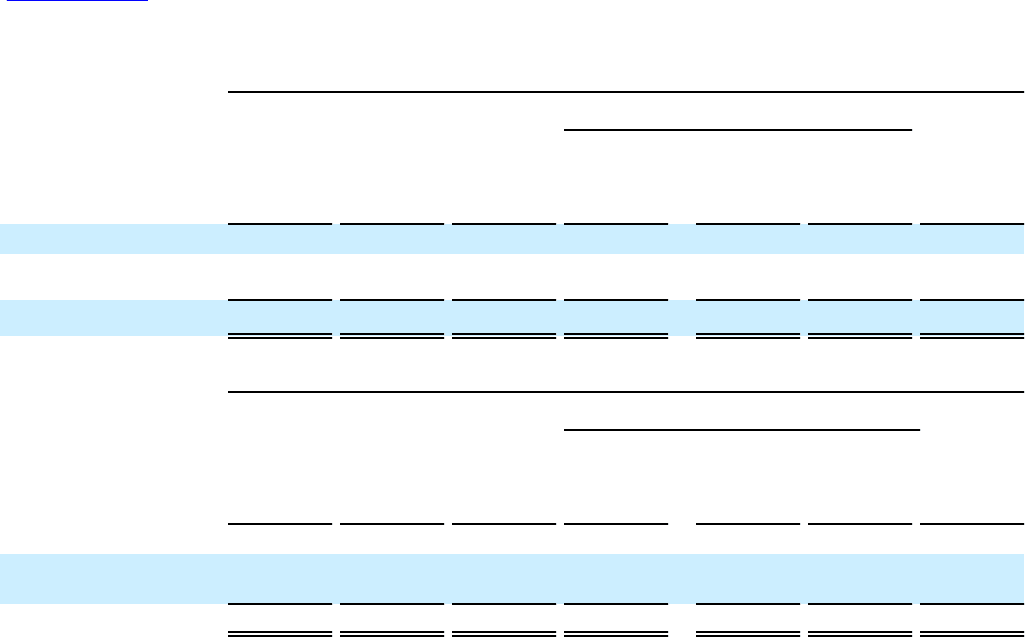
Table of Contents Alphabet Inc. and Google Inc.
72
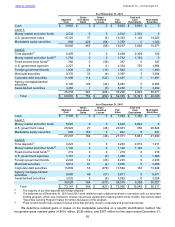
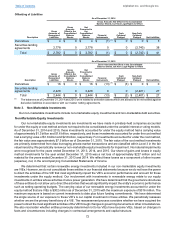
Offsetting of Liabilities
As of December 31, 2014
Gross Amounts Not Offset in the Consolidated
Balance Sheets, but Have Legal Rights to Offset
Description
Gross
Amounts of
Recognized
Liabilities
Gross
Amounts
Offset in the
Consolidated
Balance
Sheets
Net
Presented in
the
Consolidated
Balance
Sheets Financial
Instruments
Cash
Collateral
Pledged
Non-Cash
Collateral
Pledged Net Liabilities
Derivatives $ 4$0$4$ (1) (3) $ 0 $ 0 $ 3
Securities lending
agreements 2,778 0 2,778 0 0 (2,740) 38
Total $ 2,782 $0$ 2,782 $ (1) $ 0 $ (2,740) $ 41
As of December 31, 2015
Gross Amounts Not Offset in the Consolidated
Balance Sheets, but Have Legal Rights to Offset
Description
Gross
Amounts of
Recognized
Liabilities
Gross
Amounts
Offset in the
Consolidated
Balance
Sheets
Net
Presented in
the
Consolidated
Balance
Sheets Financial
Instruments
Cash
Collateral
Pledged
Non-Cash
Collateral
Pledged Net Liabilities
Derivatives $ 16 $0$ 16 $ (13) (3) $ (3) $ 0 $ 0
Securities lending
agreements 2,428 0 2,428 0 0 (2,401) 27
Total $ 2,444 $0$ 2,444 $ (13) $ (3) $ (2,401) $ 27
(3) The balances as of December 31, 2014 and 2015 were related to derivative assets which are allowed to be net settled against
derivative liabilities in accordance with our master netting agreements.
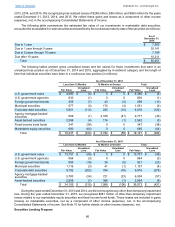
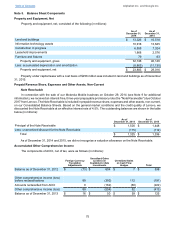
Note 3. Non-Marketable Investments
Our non-marketable investments include non-marketable equity investments and non-marketable debt securities.
Non-Marketable Equity Investments
Our non-marketable equity investments are investments we have made in privately-held companies accounted
for under the equity or cost method and are not required to be consolidated under the variable interest or voting models.
As of December 31, 2014 and 2015, these investments accounted for under the equity method had a carrying value
of approximately $1.3 billion and $1.6 billion, respectively, and those investments accounted for under the cost method
had a carrying value of $1.8 billion and $2.6 billion, respectively. For investments accounted for under the cost method,
the fair value was approximately $7.5 billion as of December 31, 2015. The fair value of the cost method investments
are primarily determined from data leveraging private-market transactions and are classified within Level 3 in the fair
value hierarchy. We periodically review our non-marketable equity investments for impairment. No material impairments
were recognized for the years ended December 31, 2013, 2014, and 2015. Our share of gains and losses in equity
method investments for the year ended December 31, 2015 was a net loss of approximately $227 million and not
material for the years ended December 31, 2013 and 2014. We reflect these losses as a component of other income
(expense), net, in the accompanying Consolidated Statements of Income.
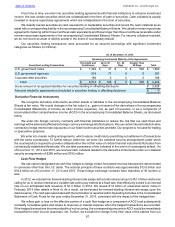
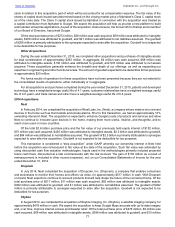
We determined that certain renewable energy investments included in our non-marketable equity investments
are VIEs. However, we do not consolidate these entities in our financial statements because we do not have the power
to direct the activities of the VIE that most significantly impact the VIE's economic performance and account for those
investments under the equity method. Our involvement with investments in renewable energy relate to our equity
investments in entities whose activities involve power generation. We have determined that the governance structures
of these entities do not allow us to direct the activities that would significantly impact the entity's economic performance
such as setting operating budgets. The carrying value of our renewable energy investments accounted for under the
equity method that are VIEs is $302 million as of December 31, 2015 with the maximum exposure of $316 million. The
maximum exposure is based on current investments to date plus future funding commitments. We have determined
the single source of our exposure to these VIE’s is our capital investment in these entities. We periodically reassess
whether we are the primary beneficiary of a VIE. The reassessment process considers whether we have acquired the
power to direct the most significant activities of the VIE through changes in governing documents or other circumstances.
We also reconsider whether entities previously determined not to be VIEs have become VIEs, based on changes in
facts and circumstances including changes in contractual arrangements and capital structure.