Google 2015 Annual Report Download - page 94
Download and view the complete annual report
Please find page 94 of the 2015 Google annual report below. You can navigate through the pages in the report by either clicking on the pages listed below, or by using the keyword search tool below to find specific information within the annual report.-
 1
1 -
2
-
3
-
4
-
5
-
6
-
7
-
8
-
9
-
10
-
11
-
12
-
13
-
14
-
15
-
16
-
17
-
18
-
19
-
20
-
21
-
22
-
23
-
24
-
25
-
26
-
27
-
28
-
29
-
30
-
31
-
32
-
33
-
34
-
35
-
36
-
37
-
38
-
39
-
40
-
41
-
42
-
43
-
44
-
45
-
46
-
47
-
48
-
49
-
50
-
51
-
52
-
53
-
54
-
55
-
56
-
57
-
58
-
59
-
60
-
61
-
62
-
63
-
64
-
65
-
66
-
67
-
68
-
69
-
70
-
71
-
72
-
73
-
74
-
75
-
76
-
77
-
78
-
79
-
80
-
81
-
82
-
83
-
 84
84 -
 85
85 -
 86
86 -
 87
87 -
 88
88 -
 89
89 -
 90
90 -
 91
91 -
 92
92 -
 93
93 -
 94
94 -
 95
95 -
 96
96 -
 97
97 -
 98
98 -
 99
99 -
 100
100 -
 101
101 -
 102
102 -
 103
103 -
 104
104 -
105
-
106
-
107
-
108
-
109
-
110
-
111
-
112
-
113
-
114
-
115
-
116
-
117
-
118
-
119
-
120
-
121
-
122
-
123
-
124
-
125
-
126
-
127
 |
 |

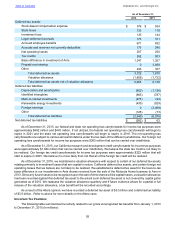
Table of Contents Alphabet Inc. and Google Inc.
90
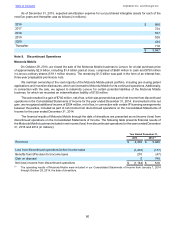
compensation associated with equity awards for the years ended December 31, 2013, 2014 and 2015 are presented
as stock-based compensation expense in Alphabet's and Google's Consolidated Statements of Stockholders' Equity.
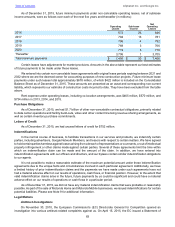
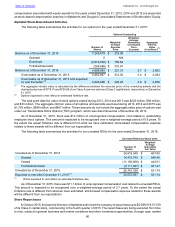
Alphabet Stock-Based Award Activities
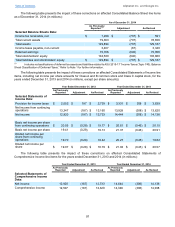
The following table summarizes the activities for our options for the year ended December 31, 2015:
Options Outstanding
Number of
Shares
Weighted-
Average
Exercise
Price
Weighted-
Average
Remaining
Contractual
Term
(in years)
Aggregate
Intrinsic
Value
(in millions)(1)
Balance as of December 31, 2014 7,240,419 $ 215.56
Granted 0 N/A
Exercised (2,072,550) $ 189.64
Forfeited/canceled (268,886) $ 310.47
Balance as of December 31, 2015 4,898,983 $ 221.31 3.7 $ 2,682
Exercisable as of December 31, 2015 4,462,847 $ 212.02 3.4 $ 2,484
Exercisable as of December 31, 2015 and expected
to vest thereafter (2) 4,846,996 $ 220.29 3.6 $ 2,658
(1) The aggregate intrinsic value is calculated as the difference between the exercise price of the underlying awards and the
closing stock prices of $778.01 and $758.88 of our Class A common stock and Class C capital stock, respectively, on December
31, 2015.
(2) Options expected to vest reflect an estimated forfeiture rate.
The total grant date fair value of stock options vested during 2013, 2014 and 2015 was $223 million, $94 million,
and $33 million. The aggregate intrinsic value of all options and warrants exercised during 2013, 2014 and 2015 was
$1,793 million, $589 million, and $867 million. These amounts do not include the aggregate sales price of options sold
under our Transferable Stock Options (TSO) program, which was discontinued as of November 29, 2013.
As of December 31, 2015, there was $12 million of unrecognized compensation cost related to outstanding
employee stock options. This amount is expected to be recognized over a weighted-average period of 0.6 years. To
the extent the actual forfeiture rate is different from what we have estimated, stock-based compensation expense
related to these awards will be different from our expectations.
The following table summarizes the activities for our unvested RSUs for the year ended December 31, 2015:
Unvested Restricted Stock Units
Number of
Shares
Weighted-
Average
Grant-Date
Fair Value
Unvested as of December 31, 2014 24,619,549 $ 487.80
Granted 14,415,740 $ 546.46
Vested (11,182,606) $ 442.01
Forfeited/canceled (2,111,497) $ 481.37
Unvested as of December 31, 2015 25,741,186 $ 531.74
Expected to vest after December 31, 2015 (1) 22,672,837 $ 531.74
(1) RSUs expected to vest reflect an estimated forfeiture rate.
As of December 31, 2015, there was $11.1 billion of unrecognized compensation cost related to unvested RSUs.
This amount is expected to be recognized over a weighted-average period of 2.7 years. To the extent the actual
forfeiture rate is different from what we have estimated, stock-based compensation expense related to these awards
will be different from our expectations.
Share Repurchases
In October 2015, the board of directors of Alphabet authorized the company to repurchase up to $5,099,019,513.59
of its Class C capital stock, commencing in the fourth quarter of 2015. The repurchases are being executed from time
to time, subject to general business and market conditions and other investment opportunities, through open market