Google 2015 Annual Report Download - page 90
Download and view the complete annual report
Please find page 90 of the 2015 Google annual report below. You can navigate through the pages in the report by either clicking on the pages listed below, or by using the keyword search tool below to find specific information within the annual report.-
 1
1 -
2
-
3
-
4
-
5
-
6
-
7
-
8
-
9
-
10
-
11
-
12
-
13
-
14
-
15
-
16
-
17
-
18
-
19
-
20
-
21
-
22
-
23
-
24
-
25
-
26
-
27
-
28
-
29
-
30
-
31
-
32
-
33
-
34
-
35
-
36
-
37
-
38
-
39
-
40
-
41
-
42
-
43
-
44
-
45
-
46
-
47
-
48
-
49
-
50
-
51
-
52
-
53
-
54
-
55
-
56
-
57
-
58
-
59
-
60
-
61
-
62
-
63
-
64
-
65
-
66
-
67
-
68
-
69
-
70
-
71
-
72
-
73
-
74
-
75
-
76
-
77
-
78
-
79
-
 80
80 -
 81
81 -
 82
82 -
 83
83 -
 84
84 -
 85
85 -
 86
86 -
 87
87 -
 88
88 -
 89
89 -
 90
90 -
 91
91 -
 92
92 -
 93
93 -
 94
94 -
 95
95 -
 96
96 -
 97
97 -
 98
98 -
 99
99 -
 100
100 -
101
-
102
-
103
-
104
-
105
-
106
-
107
-
108
-
109
-
110
-
111
-
112
-
113
-
114
-
115
-
116
-
117
-
118
-
119
-
120
-
121
-
122
-
123
-
124
-
125
-
126
-
127
 |
 |
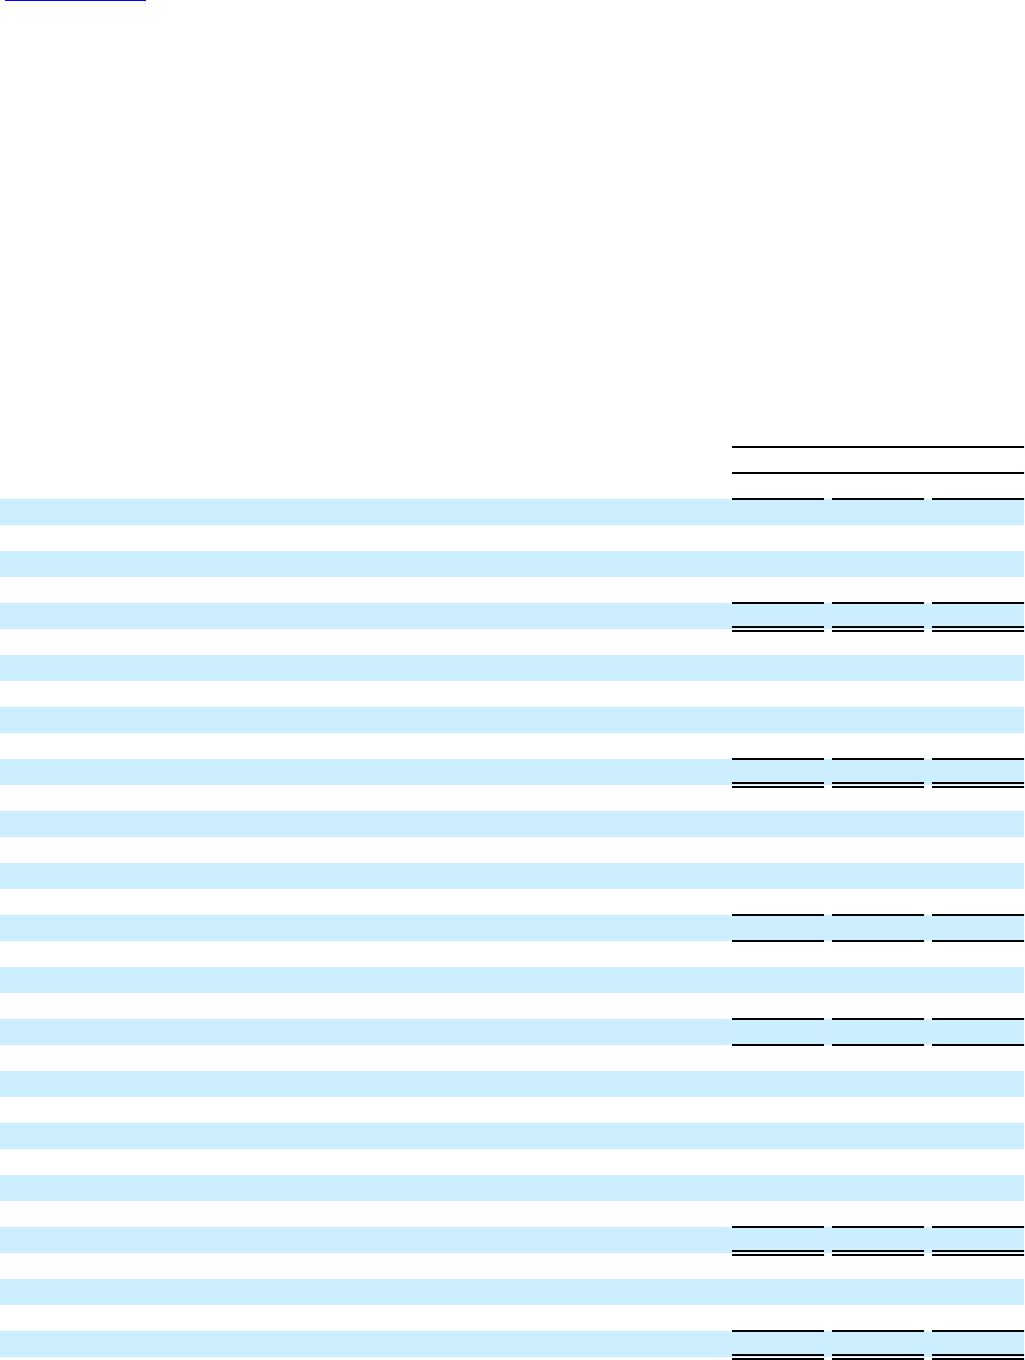
Table of Contents Alphabet Inc. and Google Inc.
86
In the years ended December 31, 2013 and 2014, the net income per share amounts are the same for Class A
and Class B common stock and Class C capital stock because the holders of each class are entitled to equal per share
dividends or distributions in liquidation in accordance with our Amended and Restated Certificate of Incorporation of
Alphabet Inc.
The par value per share of our shares of Class A and Class B common stock remained unchanged at $0.001
per share after the Stock Split. On the effective date of the Stock Split, a transfer between retained earnings and
common stock occurred in an amount equal to the $0.001 par value of the Class C capital stock that was issued.
Share and per share amounts for the prior periods presented below have been retroactively adjusted to reflect
the Stock Split.
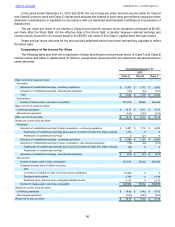
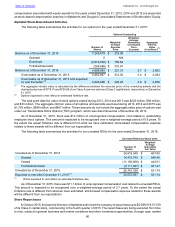
Computation of Net Income Per Share
The following table sets forth the computation of basic and diluted net income per share of Class A and Class B
common stock and Class C capital stock (in millions, except share amounts which are reflected in thousands and per
share amounts):
Year Ended December 31,
2013
Class A Class B Class C
Basic net income (loss) per share:
Numerator
Allocation of undistributed earnings - continuing operations $5,407 $1,173 $6,580
Allocation of undistributed earnings - discontinued operations (175)(38)(214)
Total $5,232 $1,135 $6,366
Denominator
Number of shares used in per share computation 273,518 59,328 332,846
Basic net income (loss) per share:
Continuing operations $19.77 $19.77 $19.77
Discontinued operations (0.64)(0.64)(0.64)
Basic net income per share $19.13 $19.13 $19.13
Diluted net income (loss) per share:
Numerator
Allocation of undistributed earnings for basic computation - continuing operations $5,407 $1,173 $6,580
Reallocation of undistributed earnings as a result of conversion of Class B to Class A shares 1,173 0 0
Reallocation of undistributed earnings 0(21)0
Allocation of undistributed earnings - continuing operations $6,580 $1,152 $6,580
Allocation of undistributed earnings for basic computation - discontinued operations (175)(38)(214)
Reallocation of undistributed earnings as a result of conversion of Class B to Class A shares (38)0 0
Reallocation of undistributed earnings (1) 1 1
Allocation of undistributed earnings - discontinued operations $(214) $ (37) $ (213)
Denominator
Number of shares used in basic computation 273,518 59,328 332,846
Weighted-average effect of dilutive securities
Add:
Conversion of Class B to Class A common shares outstanding 59,328 0 0
Employee stock options 2,748 4 2,748
Restricted stock units and other contingently issuable shares 3,215 0 3,215
Number of shares used in per share computation 338,809 59,332 338,809
Diluted net income (loss) per share:
Continuing operations $19.42 $19.42 $19.42
Discontinued operations (0.63)(0.63)(0.63)
Diluted net income per share $18.79 $18.79 $18.79