Google 2015 Annual Report Download - page 99
Download and view the complete annual report
Please find page 99 of the 2015 Google annual report below. You can navigate through the pages in the report by either clicking on the pages listed below, or by using the keyword search tool below to find specific information within the annual report.-
 1
1 -
2
-
3
-
4
-
5
-
6
-
7
-
8
-
9
-
10
-
11
-
12
-
13
-
14
-
15
-
16
-
17
-
18
-
19
-
20
-
21
-
22
-
23
-
24
-
25
-
26
-
27
-
28
-
29
-
30
-
31
-
32
-
33
-
34
-
35
-
36
-
37
-
38
-
39
-
40
-
41
-
42
-
43
-
44
-
45
-
46
-
47
-
48
-
49
-
50
-
51
-
52
-
53
-
54
-
55
-
56
-
57
-
58
-
59
-
60
-
61
-
62
-
63
-
64
-
65
-
66
-
67
-
68
-
69
-
70
-
71
-
72
-
73
-
74
-
75
-
76
-
77
-
78
-
79
-
80
-
81
-
82
-
83
-
84
-
85
-
86
-
87
-
88
-
 89
89 -
 90
90 -
 91
91 -
 92
92 -
 93
93 -
 94
94 -
 95
95 -
 96
96 -
 97
97 -
 98
98 -
 99
99 -
 100
100 -
 101
101 -
 102
102 -
 103
103 -
 104
104 -
 105
105 -
 106
106 -
 107
107 -
 108
108 -
 109
109 -
110
-
111
-
112
-
113
-
114
-
115
-
116
-
117
-
118
-
119
-
120
-
121
-
122
-
123
-
124
-
125
-
126
-
127
 |
 |
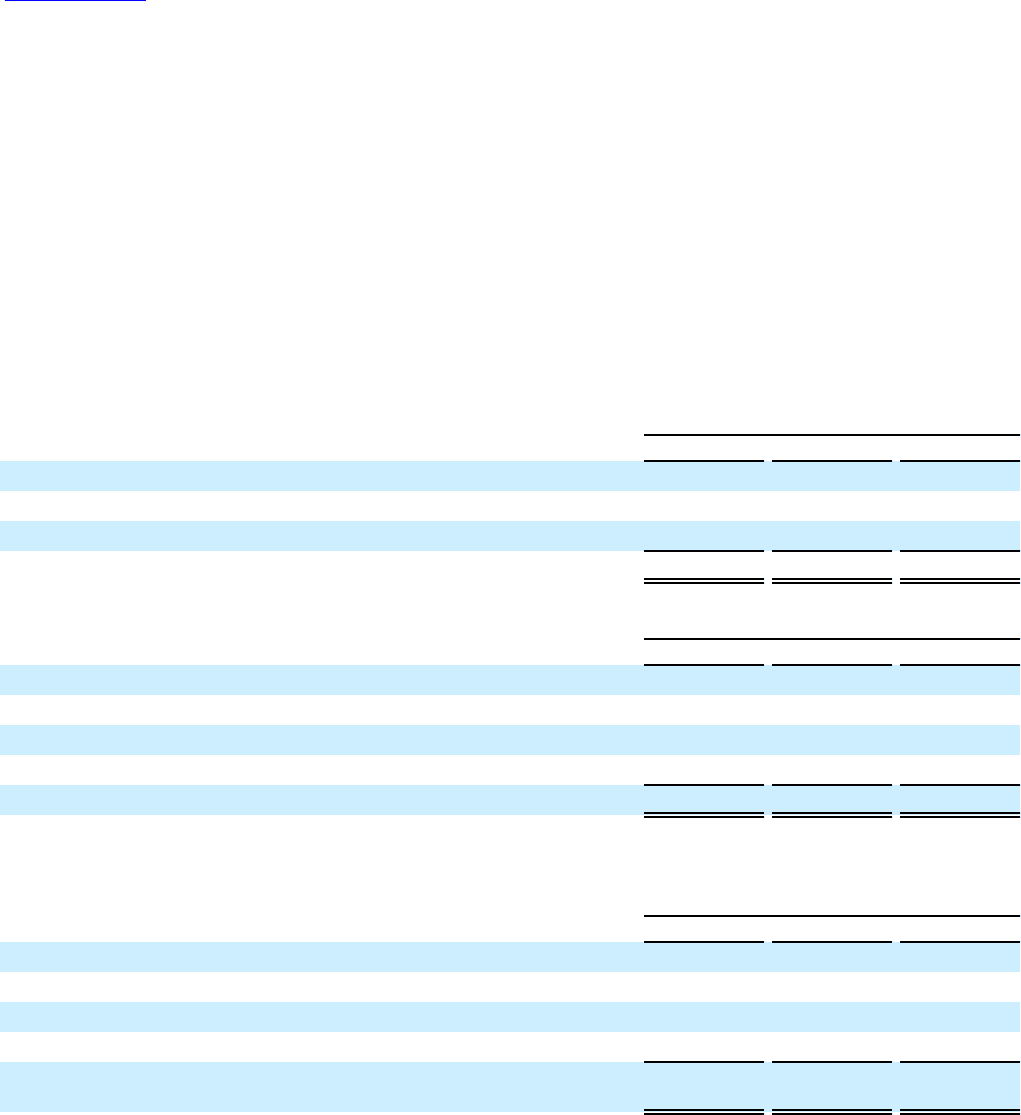
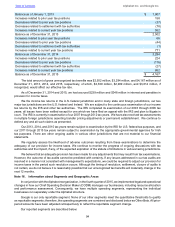
Table of Contents Alphabet Inc. and Google Inc.
95
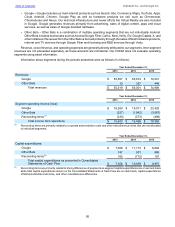
• Google – Google includes our main internet products such as Search, Ads, Commerce, Maps, YouTube, Apps,
Cloud, Android, Chrome, Google Play as well as hardware products we sell, such as Chromecast,
Chromebooks and Nexus. Our technical infrastructure and newer efforts like Virtual Reality are also included
in Google. Google generates revenues primarily from advertising, sales of digital content, apps and cloud
services, as well as sales of Google branded hardware.
• Other Bets – Other Bets is a combination of multiple operating segments that are not individually material.
Other Bets includes businesses such as Access/Google Fiber, Calico, Nest, Verily, GV, Google Capital, X, and
other initiatives. Revenues from the Other Bets is derived primarily through the sales of Nest hardware products,
internet and TV services through Google Fiber and licensing and R&D services through Verily.
Revenue, cost of revenue, and operating expenses are generally directly attributed to our segments. Inter-segment
revenues are not presented separately, as these amounts are immaterial. Our CODM does not evaluate operating
segments using asset information.
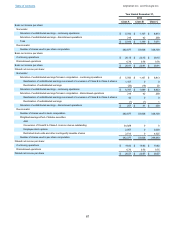
Information about segments during the periods presented were as follows (in millions):
Year Ended December 31,
2013 2014 2015
Revenues:
Google $ 55,507 $ 65,674 $ 74,541
Other Bets 12 327 448
Total revenues $ 55,519 $ 66,001 $ 74,989
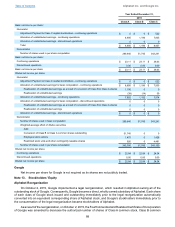
Year Ended December 31,
2013 2014 2015
Segment operating income (loss):
Google $ 16,260 $ 19,011 $ 23,425
Other Bets (527) (1,942) (3,567)
Reconciling items(1) (330) (573) (498)
Total income from operations $ 15,403 $ 16,496 $ 19,360
(1) Reconciling items are primarily related to corporate administrative costs and other miscellaneous items that are not allocated
to individual segments.
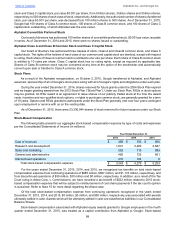
Year Ended December 31,
2013 2014 2015
Capital expenditures:
Google $ 7,006 $ 11,173 $ 8,849
Other Bets 187 501 869
Reconciling items(2) 165 (715) 197
Total capital expenditures as presented in Consolidated
Statements of Cash Flow $ 7,358 $ 10,959 $ 9,915
(2) Reconciling items are primarily related to timing differences of payments as segment capital expenditures are on accrual basis
while total capital expenditures shown on the Consolidated Statements of Cash Flow are on cash basis, capital expenditures
of Motorola Mobile and Home, and other miscellaneous differences.