Google 2015 Annual Report Download - page 39
Download and view the complete annual report
Please find page 39 of the 2015 Google annual report below. You can navigate through the pages in the report by either clicking on the pages listed below, or by using the keyword search tool below to find specific information within the annual report.-
 1
1 -
2
-
3
-
4
-
5
-
6
-
7
-
8
-
9
-
10
-
11
-
12
-
13
-
14
-
15
-
16
-
17
-
18
-
19
-
20
-
21
-
22
-
23
-
24
-
25
-
26
-
27
-
28
-
 29
29 -
 30
30 -
 31
31 -
 32
32 -
 33
33 -
 34
34 -
 35
35 -
 36
36 -
 37
37 -
 38
38 -
 39
39 -
 40
40 -
 41
41 -
 42
42 -
 43
43 -
 44
44 -
 45
45 -
 46
46 -
 47
47 -
 48
48 -
 49
49 -
50
-
51
-
52
-
53
-
54
-
55
-
56
-
57
-
58
-
59
-
60
-
61
-
62
-
63
-
64
-
65
-
66
-
67
-
68
-
69
-
70
-
71
-
72
-
73
-
74
-
75
-
76
-
77
-
78
-
79
-
80
-
81
-
82
-
83
-
84
-
85
-
86
-
87
-
88
-
89
-
90
-
91
-
92
-
93
-
94
-
95
-
96
-
97
-
98
-
99
-
100
-
101
-
102
-
103
-
104
-
105
-
106
-
107
-
108
-
109
-
110
-
111
-
112
-
113
-
114
-
115
-
116
-
117
-
118
-
119
-
120
-
121
-
122
-
123
-
124
-
125
-
126
-
127
 |
 |

Table of Contents Alphabet Inc. and Google Inc.
35
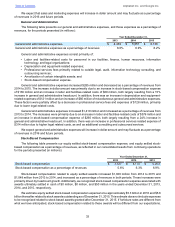
in various taxing jurisdictions. Further information on these issues, the treatment of undistributed foreign earnings and
a reconciliation of the federal statutory income tax rate to our effective tax rate can be found in Notes 11 and 15 of
Part II, Item 8 of this Annual Report on Form 10-K.
See Critical Accounting Policies and Estimates below for additional information about our provision for income
taxes.
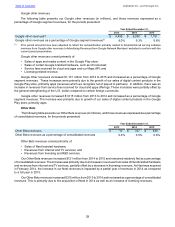
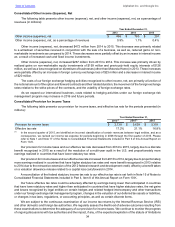
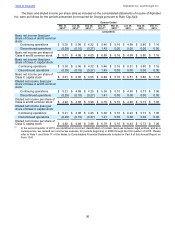
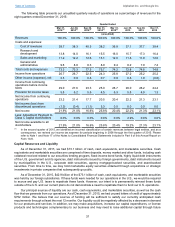
Quarterly Results of Operations
The following tables presenting our quarterly results of operations should be read in conjunction with the
consolidated financial statements and related notes included in Item 8 of this Annual Report on Form 10-K. We have
prepared the unaudited information on the same basis as our audited consolidated financial statements. Our operating
results for any quarter are not necessarily indicative of results for any future quarters or for a full year.
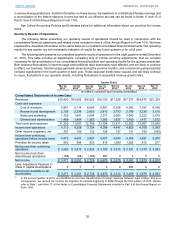
The following table presents our unaudited quarterly results of operations for the eight quarters ended December
31, 2015. This table includes all adjustments, consisting only of normal recurring adjustments, that we consider
necessary for fair presentation of our consolidated financial position and operating results for the quarters presented.
Both seasonal fluctuations in internet usage and traditional retail seasonality have affected, and are likely to continue
to affect, our business. Internet usage generally slows during the summer months, and commercial queries typically
increase significantly in the fourth quarter of each year. These seasonal trends have caused, and will likely continue
to cause, fluctuations in our quarterly results, including fluctuations in sequential revenue growth rates.
Quarter Ended
Mar 31,
2014(1) Jun 30,
2014(1) Sep 30,
2014(1) Dec 31,
2014(1) Mar 31,
2015(1) Jun 30,
2015 Sep 30,
2015 Dec 31,
2015
(In millions, except per share amounts) (unaudited)
Consolidated Statements of Income Data:
Revenues $15,420 $15,955 $16,523 $18,103 $17,258 $17,727 $18,675 $21,329
Costs and expenses:
Cost of revenues 5,961 6,114 6,695 6,921 6,356 6,583 7,037 8,188
Research and development 2,126 2,238 2,655 2,813 2,753 2,789 3,230 3,510
Sales and marketing 1,729 1,941 2,084 2,377 2,065 2,080 2,223 2,679
General and administrative 1,489 1,404 1,365 1,593 1,637 1,450 1,477 1,572
Total costs and expenses 11,305 11,697 12,799 13,704 12,811 12,902 13,967 15,949
Income from operations 4,115 4,258 3,724 4,399 4,447 4,825 4,708 5,380
Other income (expense), net 357 145 133 128 157 131 183 (180)
Income from continuing
operations before income taxes 4,472 4,403 3,857 4,527 4,604 4,956 4,891 5,200
Provision for income taxes 903 984 933 819 1,089 1,025 912 277
Net income from continuing
operations $3,569 $3,419 $ 2,924 $ 3,708 $ 3,515 $ 3,931 $ 3,979 $ 4,923
Net income (loss) from
discontinued operations (198)(68)(185) 967 0 0 0 0
Net income $ 3,371 $3,351 $ 2,739 $ 4,675 $ 3,515 $ 3,931 $ 3,979 $ 4,923
Less: Adjustment Payment to
Class C capital stockholders 00 0 0 0 522 0 0
Net income available to all
stockholders $3,371 $3,351 $ 2,739 $ 4,675 $ 3,515 $ 3,409 $ 3,979 $ 4,923
(1) In the second quarter of 2015, we identified an incorrect classification of certain revenues between legal entities, and as a
consequence, we revised our income tax expense for periods beginning in 2008 through the first quarter of 2015. Please
refer to Note 1 and Note 17 of the Notes to Consolidated Financial Statements included in Part II of this Annual Report on
Form 10-K.