Google 2015 Annual Report Download - page 25
Download and view the complete annual report
Please find page 25 of the 2015 Google annual report below. You can navigate through the pages in the report by either clicking on the pages listed below, or by using the keyword search tool below to find specific information within the annual report.-
 1
1 -
2
-
3
-
4
-
5
-
6
-
7
-
8
-
9
-
10
-
11
-
12
-
13
-
14
-
 15
15 -
 16
16 -
 17
17 -
 18
18 -
 19
19 -
 20
20 -
 21
21 -
 22
22 -
 23
23 -
 24
24 -
 25
25 -
 26
26 -
 27
27 -
 28
28 -
 29
29 -
 30
30 -
 31
31 -
 32
32 -
 33
33 -
 34
34 -
 35
35 -
36
-
37
-
38
-
39
-
40
-
41
-
42
-
43
-
44
-
45
-
46
-
47
-
48
-
49
-
50
-
51
-
52
-
53
-
54
-
55
-
56
-
57
-
58
-
59
-
60
-
61
-
62
-
63
-
64
-
65
-
66
-
67
-
68
-
69
-
70
-
71
-
72
-
73
-
74
-
75
-
76
-
77
-
78
-
79
-
80
-
81
-
82
-
83
-
84
-
85
-
86
-
87
-
88
-
89
-
90
-
91
-
92
-
93
-
94
-
95
-
96
-
97
-
98
-
99
-
100
-
101
-
102
-
103
-
104
-
105
-
106
-
107
-
108
-
109
-
110
-
111
-
112
-
113
-
114
-
115
-
116
-
117
-
118
-
119
-
120
-
121
-
122
-
123
-
124
-
125
-
126
-
127
 |
 |

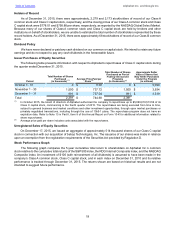
Table of Contents Alphabet Inc. and Google Inc.
21
The consolidated statements of income data of Alphabet and Google were as follows for the periods presented:
Year Ended December 31,
2011(1) 2012(1) 2013(1) 2014(1) 2015
(in millions)
Consolidated Statements of Income Data:
Revenues $ 37,905 $ 46,039 $ 55,519 $ 66,001 $ 74,989
Income from operations 11,742 13,834 15,403 16,496 19,360
Net income from continuing operations 9,706 11,435 13,160 13,620 16,348
Net income (loss) from discontinued
operations 0(816) (427) 516 0
Net income 9,706 10,619 12,733 14,136 16,348
(1) In the second quarter of 2015, we identified an incorrect classification of certain revenues between legal entities, and as a
consequence, we revised our income tax expense for periods beginning in 2008 through the first quarter of 2015. Please
refer to Note 1 and Note 17 of the Notes to Consolidated Financial Statements included in Part II of this Annual Report on
Form 10-K.
The basic and diluted income per share data as included on the consolidated statements of income of Alphabet
were as follows for the periods presented (not required for Google pursuant to Rule 12g-3(a)):
Year Ended December 31,
2011(1) 2012(1) 2013(1) 2014(1) 2015
(in millions, except per share amounts)
Basic net income (loss) per share of Class
A and B common stock:
Continuing operations $ 15.04 $ 17.47 $ 19.77 $ 20.15 $ 23.11
Discontinued operations 0.00 (1.25) (0.64) 0.76 0.00
Basic net income per share of Class A and
B common stock $15.04 $ 16.22 $ 19.13 $ 20.91 $ 23.11
Basic net income (loss) per share of Class
C capital stock:
Continuing operations $15.04 $ 17.47 $ 19.77 $ 20.15 $ 24.63
Discontinued operations 0.00 (1.25) (0.64) 0.76 0.00
Basic net income per share of Class C
capital stock $15.04 $ 16.22 $ 19.13 $ 20.91 $ 24.63
Diluted net income (loss) per share of
Class A and B common stock:
Continuing operations $ 14.83 $ 17.21 $ 19.42 $ 19.82 $ 22.84
Discontinued operations 0.00 (1.23) (0.63) 0.75 0.00
Diluted net income per share of Class A
and B common stock $14.83 $ 15.98 $ 18.79 $ 20.57 $ 22.84
Diluted net income (loss) per share of
Class C capital stock:
Continuing operations $14.83 $ 17.21 $ 19.42 $ 19.82 $ 24.34
Discontinued operations 0.00 (1.23) (0.63) 0.75 0.00
Diluted net income per share of Class C
capital stock $14.83 $ 15.98 $ 18.79 $ 20.57 $ 24.34
(1) In the second quarter of 2015, we identified an incorrect classification of certain revenues between legal entities, and as a
consequence, we revised our income tax expense for periods beginning in 2008 through the first quarter of 2015. Please
refer to Note 1 and Note 17 of the Notes to Consolidated Financial Statements included in Part II of this Annual Report on
Form 10-K