Google 2015 Annual Report Download - page 86
Download and view the complete annual report
Please find page 86 of the 2015 Google annual report below. You can navigate through the pages in the report by either clicking on the pages listed below, or by using the keyword search tool below to find specific information within the annual report.-
 1
1 -
2
-
3
-
4
-
5
-
6
-
7
-
8
-
9
-
10
-
11
-
12
-
13
-
14
-
15
-
16
-
17
-
18
-
19
-
20
-
21
-
22
-
23
-
24
-
25
-
26
-
27
-
28
-
29
-
30
-
31
-
32
-
33
-
34
-
35
-
36
-
37
-
38
-
39
-
40
-
41
-
42
-
43
-
44
-
45
-
46
-
47
-
48
-
49
-
50
-
51
-
52
-
53
-
54
-
55
-
56
-
57
-
58
-
59
-
60
-
61
-
62
-
63
-
64
-
65
-
66
-
67
-
68
-
69
-
70
-
71
-
72
-
73
-
74
-
75
-
 76
76 -
 77
77 -
 78
78 -
 79
79 -
 80
80 -
 81
81 -
 82
82 -
 83
83 -
 84
84 -
 85
85 -
 86
86 -
 87
87 -
 88
88 -
 89
89 -
 90
90 -
 91
91 -
 92
92 -
 93
93 -
 94
94 -
 95
95 -
 96
96 -
97
-
98
-
99
-
100
-
101
-
102
-
103
-
104
-
105
-
106
-
107
-
108
-
109
-
110
-
111
-
112
-
113
-
114
-
115
-
116
-
117
-
118
-
119
-
120
-
121
-
122
-
123
-
124
-
125
-
126
-
127
 |
 |
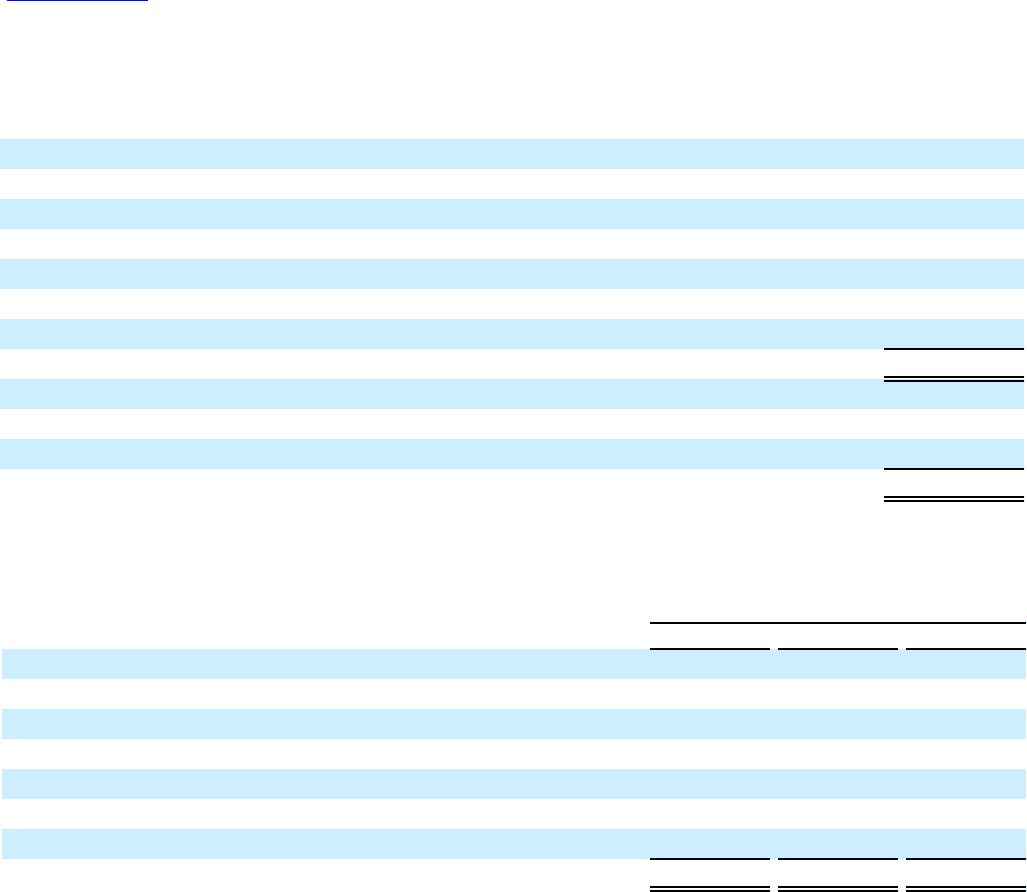
Table of Contents Alphabet Inc. and Google Inc.
82
The following table presents the aggregate carrying amounts of the major classes of assets and liabilities divested
(in millions):
Assets:
Accounts receivable $ 424
Inventories 228
Deferred income taxes, net 144
Prepaid and other current assets 152
Property and equipment, net 282
Intangible assets, net 701
Other assets, non-current 182
Total assets $ 2,113
Liabilities:
Accounts payable $ 169
Accrued expenses and other liabilities 289
Total liabilities $ 458
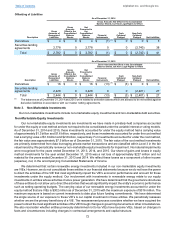
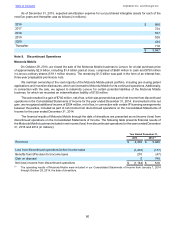
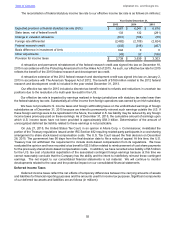
Note 10. Other Income (Expense), Net
The components of other income (expense), net, were as follows (in millions):
Year Ended December 31,
2013 2014 2015
Interest income $ 766 $ 746 $ 999
Interest expense (81) (101) (104)
Gain (loss) on marketable securities, net 158 153 (208)
Foreign currency exchange losses, net (1) (379) (402) (422)
Gain (loss) on non-marketable investments, net 8 237 (126)
Loss on divestiture of businesses (2) (57) 0 0
Other 81 130 152
Other income (expense), net $ 496 $ 763 $ 291
(1) Our foreign currency exchange losses,net are related to the option premium costs and forward points for our foreign currency
hedging contracts, our foreign exchange transaction gains and losses from the conversion of the transaction currency to the
functional currency, offset by the foreign currency hedging contract losses and gains. The net foreign currency transaction
losses were $121 million, $107 million, and $123 million in 2013, 2014, and 2015, respectively.
(2) Gain on divestiture of Motorola Home business was included in net income (loss) from discontinued operations for the year
ended December 31, 2013. Gain on divestiture of Motorola Mobile business was included in net income (loss) from discontinued
operations for the year ended December 31, 2014.
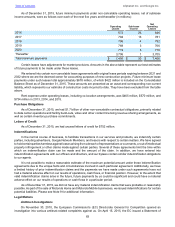
Note 11. Commitments and Contingencies
Operating Leases
We have entered into various non-cancelable operating lease agreements for certain of our offices, facilities,
land, and data centers throughout the world with original lease periods expiring primarily between 2016 and 2063. We
are committed to pay a portion of the actual operating expenses under certain of these lease agreements. These
operating expenses are not included in the table below. Certain of these arrangements have free or escalating rent
payment provisions. We recognize rent expense under such arrangements on a straight-line basis.