Google 2015 Annual Report Download - page 29
Download and view the complete annual report
Please find page 29 of the 2015 Google annual report below. You can navigate through the pages in the report by either clicking on the pages listed below, or by using the keyword search tool below to find specific information within the annual report.-
 1
1 -
2
-
3
-
4
-
5
-
6
-
7
-
8
-
9
-
10
-
11
-
12
-
13
-
14
-
15
-
16
-
17
-
18
-
 19
19 -
 20
20 -
 21
21 -
 22
22 -
 23
23 -
 24
24 -
 25
25 -
 26
26 -
 27
27 -
 28
28 -
 29
29 -
 30
30 -
 31
31 -
 32
32 -
 33
33 -
 34
34 -
 35
35 -
 36
36 -
 37
37 -
 38
38 -
 39
39 -
40
-
41
-
42
-
43
-
44
-
45
-
46
-
47
-
48
-
49
-
50
-
51
-
52
-
53
-
54
-
55
-
56
-
57
-
58
-
59
-
60
-
61
-
62
-
63
-
64
-
65
-
66
-
67
-
68
-
69
-
70
-
71
-
72
-
73
-
74
-
75
-
76
-
77
-
78
-
79
-
80
-
81
-
82
-
83
-
84
-
85
-
86
-
87
-
88
-
89
-
90
-
91
-
92
-
93
-
94
-
95
-
96
-
97
-
98
-
99
-
100
-
101
-
102
-
103
-
104
-
105
-
106
-
107
-
108
-
109
-
110
-
111
-
112
-
113
-
114
-
115
-
116
-
117
-
118
-
119
-
120
-
121
-
122
-
123
-
124
-
125
-
126
-
127
 |
 |

Table of Contents Alphabet Inc. and Google Inc.
25
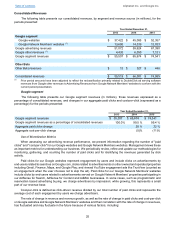
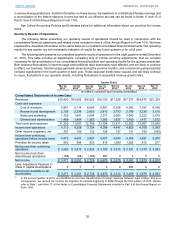
Consolidated Revenues
The following table presents our consolidated revenues, by segment and revenue source (in millions), for the
periods presented:
Year Ended December 31,
2013 2014 2015
Google segment
Google websites $ 37,422 $ 45,085 $ 52,357
Google Network Members' websites (1) 13,650 14,539 15,033
Google advertising revenues 51,072 59,624 67,390
Google other revenues (1) 4,435 6,050 7,151
Google segment revenues $ 55,507 $ 65,674 $ 74,541
Other Bets
Other Bets revenues $ 12 $ 327 $ 448
Consolidated revenues $ 55,519 $ 66,001 $ 74,989
(1) Prior period amounts have been adjusted to reflect the reclassification primarily related to DoubleClick ad serving software
revenues from Google other revenues to Advertising Revenues from Google Network Members' websites to conform with the
current period presentation.
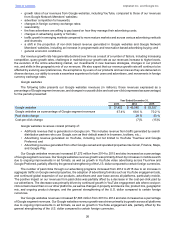
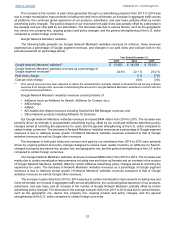
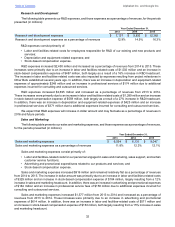
Google segment
The following table presents our Google segment revenues (in millions), those revenues expressed as a
percentage of consolidated revenues, and changes in our aggregate paid clicks and cost-per-click (expressed as a
percentage) for the periods presented:
Year Ended December 31,
2013 2014 2015
Google segment revenues $ 55,507 $ 65,674 $ 74,541
Google segment revenues as a percentage of consolidated revenues 100.0% 99.5 % 99.4 %
Aggregate paid clicks change 20 % 22 %
Aggregate cost-per-click change (5)% (11)%
Use of Monetization Metrics
When assessing our advertising revenue performance, we present information regarding the number of "paid
clicks" and "cost-per-click" for our Google websites and Google Network Members websites. Management views these
as important metrics for understanding our business. We periodically review, refine and update our methodologies for
monitoring, gathering, and counting the number of paid clicks and for identifying the revenues generated by click
activity.
Paid clicks for our Google websites represent engagement by users and include clicks on advertisements by
end-users related to searches on Google.com, clicks related to advertisements on other owned and operated properties
including Gmail, Finance, Maps, and Google Play; and viewed YouTube engagement ads like TrueView (counted as
an engagement when the user chooses not to skip the ad). Paid clicks for our Google Network Members' websites
include clicks by end-users related to advertisements served on Google Network Members' properties participating in
our AdSense for Search, AdSense for Content and AdMob businesses. In some cases, such as programmatic and
reservation based advertising buying, we charge advertisers by impression; while growing, this represents a small
part of our revenue base.
Cost-per-click is defined as click-driven revenue divided by our total number of paid clicks and represents the
average cost of each engagement by users we charge advertisers.
The rate of change in revenue and revenue growth, as well as the rate of change in paid clicks and cost-per-click
on Google websites and Google Network Members' websites and their correlation with the rate of change in revenues,
has fluctuated and may fluctuate in the future because of various factors, including: