Google 2015 Annual Report Download - page 36
Download and view the complete annual report
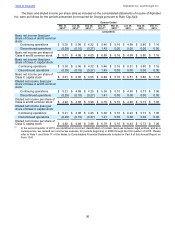
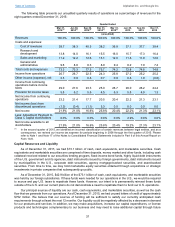
Please find page 36 of the 2015 Google annual report below. You can navigate through the pages in the report by either clicking on the pages listed below, or by using the keyword search tool below to find specific information within the annual report.-
 1
1 -
2
-
3
-
4
-
5
-
6
-
7
-
8
-
9
-
10
-
11
-
12
-
13
-
14
-
15
-
16
-
17
-
18
-
19
-
20
-
21
-
22
-
23
-
24
-
25
-
 26
26 -
 27
27 -
 28
28 -
 29
29 -
 30
30 -
 31
31 -
 32
32 -
 33
33 -
 34
34 -
 35
35 -
 36
36 -
 37
37 -
 38
38 -
 39
39 -
 40
40 -
 41
41 -
 42
42 -
 43
43 -
 44
44 -
 45
45 -
 46
46 -
47
-
48
-
49
-
50
-
51
-
52
-
53
-
54
-
55
-
56
-
57
-
58
-
59
-
60
-
61
-
62
-
63
-
64
-
65
-
66
-
67
-
68
-
69
-
70
-
71
-
72
-
73
-
74
-
75
-
76
-
77
-
78
-
79
-
80
-
81
-
82
-
83
-
84
-
85
-
86
-
87
-
88
-
89
-
90
-
91
-
92
-
93
-
94
-
95
-
96
-
97
-
98
-
99
-
100
-
101
-
102
-
103
-
104
-
105
-
106
-
107
-
108
-
109
-
110
-
111
-
112
-
113
-
114
-
115
-
116
-
117
-
118
-
119
-
120
-
121
-
122
-
123
-
124
-
125
-
126
-
127
 |
 |

Table of Contents Alphabet Inc. and Google Inc.
32
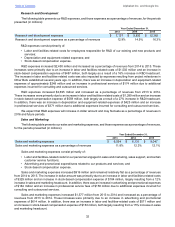
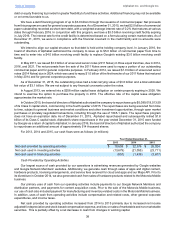
Research and Development
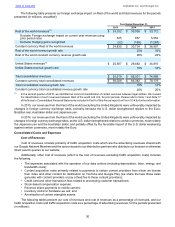
The following table presents our R&D expenses, and those expenses as a percentage of revenues, for the periods
presented (in millions):
Year Ended December 31,
2013 2014 2015
Research and development expenses $ 7,137 $ 9,832 $ 12,282
Research and development expenses as a percentage of revenues 12.9% 14.9% 16.3%
R&D expenses consist primarily of:
• Labor and facilities-related costs for employees responsible for R&D of our existing and new products and
services;
• Depreciation and equipment-related expenses; and
• Stock-based compensation expense.
R&D expenses increased $2,450 million and increased as a percentage of revenues from 2014 to 2015. These
increases were primarily due to an increase in labor and facilities-related costs of $1,502 million and an increase in
stock-based compensation expense of $487 million, both largely as a result of a 16% increase in R&D headcount.
The increase in labor and facilities-related costs was also impacted by expenses resulting from project milestones in
Other Bets established several years ago. In addition, there was an increase in depreciation and equipment-related
expenses of approximately $248 million and an increase in professional services of $174 million due to additional
expenses incurred for consulting and outsourced services.
R&D expenses increased $2,695 million and increased as a percentage of revenues from 2013 to 2014.
These increases were primarily due to an increase in labor and facilities-related costs of $1,289 million and an increase
in stock-based compensation expense of $559 million, both largely as a result of a 27% increase in R&D headcount.
In addition, there was an increase in depreciation and equipment-related expenses of $425 million and an increase
in professional services of $371 million due to additional expenses incurred for consulting and outsourced services.
We expect that R&D expenses will increase in dollar amount and may fluctuate as a percentage of revenues in
2016 and future periods.
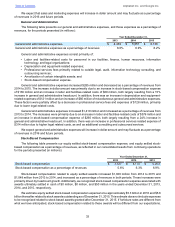
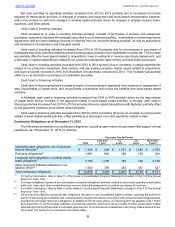
Sales and Marketing
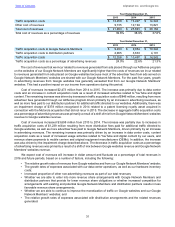
The following table presents our sales and marketing expenses, and those expenses as a percentage of revenues,
for the periods presented (in millions):
Year Ended December 31,
2013 2014 2015
Sales and marketing expenses $ 6,554 $ 8,131 $ 9,047
Sales and marketing expenses as a percentage of revenues 11.8% 12.3% 12.1%
Sales and marketing expenses consist primarily of:
• Labor and facilities-related costs for our personnel engaged in sales and marketing, sales support, and certain
customer service functions;
• Advertising and promotional expenditures related to our products and services; and
• Stock-based compensation expense.
Sales and marketing expenses increased $916 million and remained relatively flat as a percentage of revenues
from 2014 to 2015. The increase in dollar amount was primarily due to an increase in labor and facilities-related costs
of $329 million and an increase in stock-based compensation expense of $184 million, largely resulting from a 12%
increase in sales and marketing headcount. In addition, there was an increase in advertising and promotional expenses
of $184 million and an increase in professional service fees of $158 million due to additional expenses incurred for
consulting and outsourced services.
Sales and marketing expenses increased $1,577 million from 2013 to 2014 and increased as a percentage of
revenues from 2013 to 2014. These increases were primarily due to an increase in advertising and promotional
expenses of $614 million. In addition, there was an increase in labor and facilities-related costs of $571 million and
an increase in stock-based compensation expense of $163 million, both largely resulting from a 15% increase in sales
and marketing headcount.