Google 2015 Annual Report Download - page 83
Download and view the complete annual report
Please find page 83 of the 2015 Google annual report below. You can navigate through the pages in the report by either clicking on the pages listed below, or by using the keyword search tool below to find specific information within the annual report.-
 1
1 -
2
-
3
-
4
-
5
-
6
-
7
-
8
-
9
-
10
-
11
-
12
-
13
-
14
-
15
-
16
-
17
-
18
-
19
-
20
-
21
-
22
-
23
-
24
-
25
-
26
-
27
-
28
-
29
-
30
-
31
-
32
-
33
-
34
-
35
-
36
-
37
-
38
-
39
-
40
-
41
-
42
-
43
-
44
-
45
-
46
-
47
-
48
-
49
-
50
-
51
-
52
-
53
-
54
-
55
-
56
-
57
-
58
-
59
-
60
-
61
-
62
-
63
-
64
-
65
-
66
-
67
-
68
-
69
-
70
-
71
-
72
-
 73
73 -
 74
74 -
 75
75 -
 76
76 -
 77
77 -
 78
78 -
 79
79 -
 80
80 -
 81
81 -
 82
82 -
 83
83 -
 84
84 -
 85
85 -
 86
86 -
 87
87 -
 88
88 -
 89
89 -
 90
90 -
 91
91 -
 92
92 -
 93
93 -
94
-
95
-
96
-
97
-
98
-
99
-
100
-
101
-
102
-
103
-
104
-
105
-
106
-
107
-
108
-
109
-
110
-
111
-
112
-
113
-
114
-
115
-
116
-
117
-
118
-
119
-
120
-
121
-
122
-
123
-
124
-
125
-
126
-
127
 |
 |

Table of Contents Alphabet Inc. and Google Inc.
79
Google Other Bets Total
Consolidated
Balance as of December 31, 2013 $ 11,492 $ — $ 11,492
Acquisitions 4,208 — 4,208
Dispositions (43) — (43)
Foreign currency translation and other adjustments (58) — (58)
Balance as of December 31, 2014 $ 15,599 $ — $ 15,599
Acquisitions 139 — 139
Foreign currency translation and other adjustments (71) — (71)
Allocation in the fourth quarter of 2015 (416) 416 —
Acquisitions 201 4 205
Foreign currency translation and other adjustments 4 (7) (3)
Balance as of December 31, 2015 $ 15,456 $ 413 $ 15,869
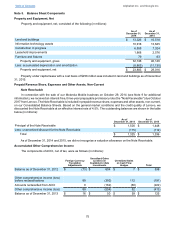
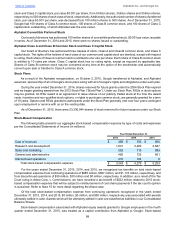
Other Intangible Assets
Information regarding our purchased intangible assets is as follows (in millions):
As of December 31, 2014
Gross
Carrying
Amount Accumulated
Amortization
Net
Carrying
Amount
Patents and developed technology $ 6,547 $ 2,513 $ 4,034
Customer relationships 1,410 1,168 242
Trade names and other 696 365 331
Total $ 8,653 $ 4,046 $ 4,607
As of December 31, 2015
Gross
Carrying
Amount Accumulated
Amortization
Net
Carrying
Value
Patents and developed technology $ 6,592 $ 3,213 $ 3,379
Customer relationships 1,343 1,201 142
Trade names and other 795 469 326
Total $ 8,730 $ 4,883 $ 3,847
Patents and developed technology, customer relationships, and trade names and other have weighted-average
useful lives from the date of purchase of 7.8 years, 6.0 years, and 5.4 years, respectively. Amortization expense relating
to our purchased intangible assets was $1,011 million, $1,079 million, and $892 million for the years ended December
31, 2013, 2014, and 2015.
During the year ended December 31, 2014, we recorded an impairment charge in other cost of revenues of $378
million related to a patent licensing royalty asset acquired in connection with the Motorola acquisition, which we retained
subsequent to the sale of Motorola Mobile. The asset was determined to be impaired due to prolonged decreased
royalty payments and unpaid interest owed and was written down to its fair value. Fair value was determined based
on a discounted cash flow method and reflects estimated future cash flows associated with the patent licensing royalty
asset at the measurement date and falls within level 3 in fair value hierarchy. Impairments of intangible assets were
not material for the year ended December 31, 2015.