Google 2015 Annual Report Download - page 69
Download and view the complete annual report
Please find page 69 of the 2015 Google annual report below. You can navigate through the pages in the report by either clicking on the pages listed below, or by using the keyword search tool below to find specific information within the annual report.-
 1
1 -
2
-
3
-
4
-
5
-
6
-
7
-
8
-
9
-
10
-
11
-
12
-
13
-
14
-
15
-
16
-
17
-
18
-
19
-
20
-
21
-
22
-
23
-
24
-
25
-
26
-
27
-
28
-
29
-
30
-
31
-
32
-
33
-
34
-
35
-
36
-
37
-
38
-
39
-
40
-
41
-
42
-
43
-
44
-
45
-
46
-
47
-
48
-
49
-
50
-
51
-
52
-
53
-
54
-
55
-
56
-
57
-
58
-
 59
59 -
 60
60 -
 61
61 -
 62
62 -
 63
63 -
 64
64 -
 65
65 -
 66
66 -
 67
67 -
 68
68 -
 69
69 -
 70
70 -
 71
71 -
 72
72 -
 73
73 -
 74
74 -
 75
75 -
 76
76 -
 77
77 -
 78
78 -
 79
79 -
80
-
81
-
82
-
83
-
84
-
85
-
86
-
87
-
88
-
89
-
90
-
91
-
92
-
93
-
94
-
95
-
96
-
97
-
98
-
99
-
100
-
101
-
102
-
103
-
104
-
105
-
106
-
107
-
108
-
109
-
110
-
111
-
112
-
113
-
114
-
115
-
116
-
117
-
118
-
119
-
120
-
121
-
122
-
123
-
124
-
125
-
126
-
127
 |
 |
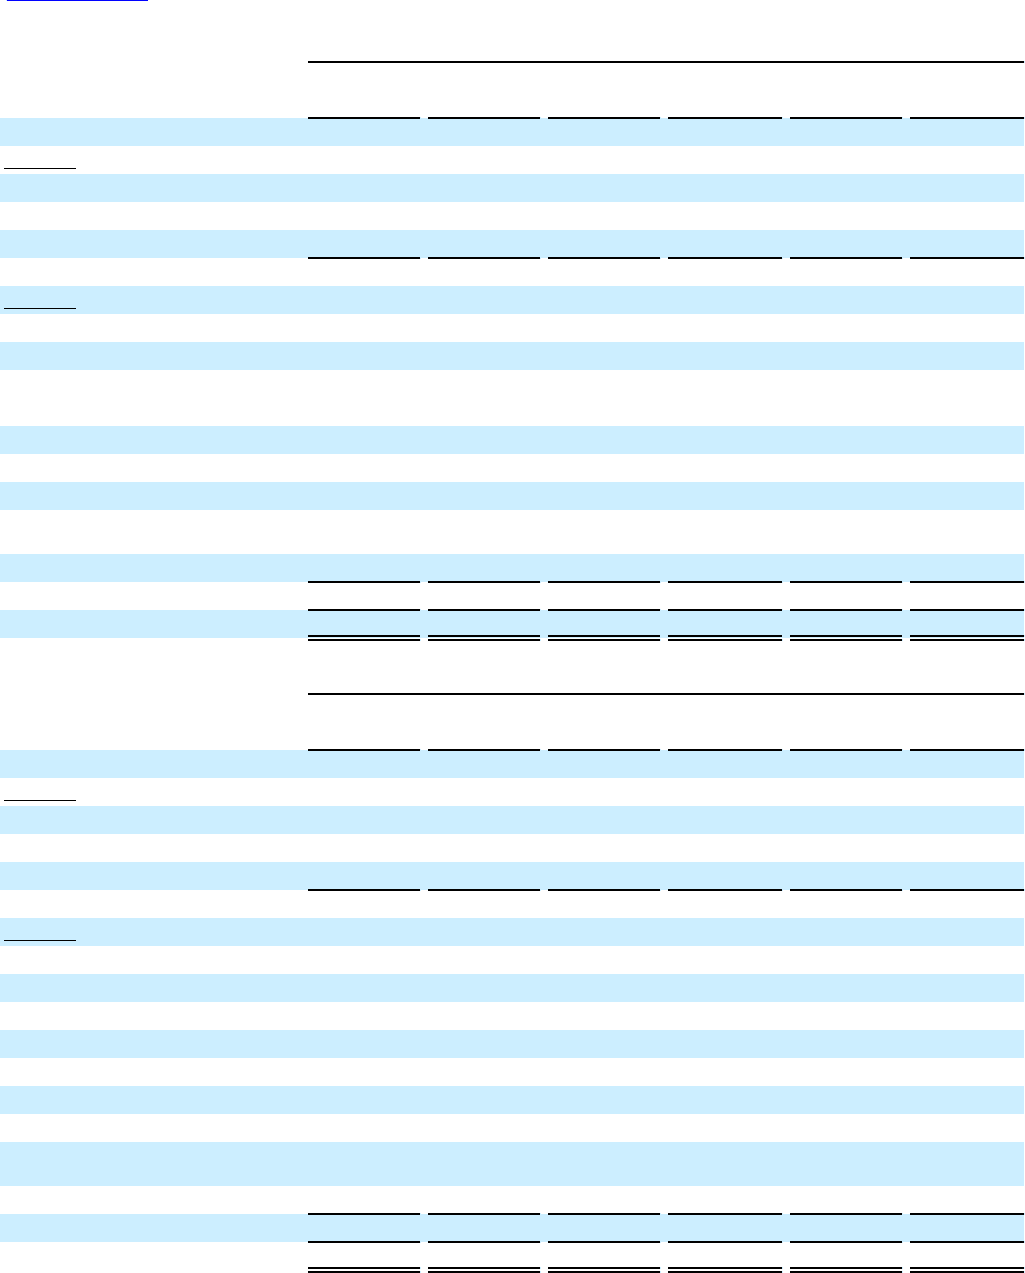
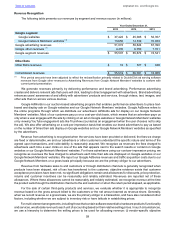
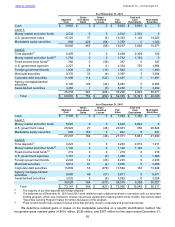
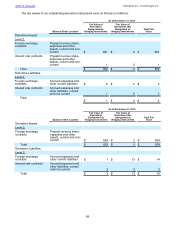
Table of Contents Alphabet Inc. and Google Inc.
65
As of December 31, 2014
Adjusted
Cost
Gross
Unrealized
Gains
Gross
Unrealized
Losses Fair
Value
Cash and
Cash
Equivalents Marketable
Securities
Cash $ 9,863 $0$ 0 $ 9,863 $ 9,863 $ 0
Level 1:
Money market and other funds 2,532 0 0 2,532 2,532 0
U.S. government notes 15,320 37 (4) 15,353 1,128 14,225
Marketable equity securities 988 428 (64) 1,352 0 1,352
18,840 465 (68) 19,237 3,660 15,577
Level 2:
Time deposits(1) 2,409 0 0 2,409 2,309 100
Money market and other funds(2) 1,762 0 0 1,762 1,762 0
Fixed-income bond funds(3) 385 0(38) 347 0 347
U.S. government agencies 2,327 8 (1) 2,334 750 1,584
Foreign government bonds 1,828 22 (10) 1,840 0 1,840
Municipal securities 3,370 33 (6) 3,397 3 3,394
Corporate debt securities 11,499 114 (122) 11,491 0 11,491
Agency mortgage-backed
securities 8,196 109 (42) 8,263 0 8,263
Asset-backed securities 3,456 1 (5) 3,452 0 3,452
35,232 287 (224) 35,295 4,824 30,471
Total $ 63,935 $ 752 $ (292) $ 64,395 $ 18,347 $ 46,048
As of December 31, 2015
Adjusted
Cost
Gross
Unrealized
Gains
Gross
Unrealized
Losses Fair
Value
Cash and
Cash
Equivalents Marketable
Securities
Cash $ 7,380 $0$ 0 $ 7,380 $ 7,380 $ 0
Level 1:
Money market and other funds 5,623 0 0 5,623 5,623 0
U.S. government notes 20,922 27 (48) 20,901 258 20,643
Marketable equity securities 692 155 0 847 0 847
27,237 182 (48) 27,371 5,881 21,490
Level 2:
Time deposits(1) 3,223 0 0 3,223 2,012 1,211
Money market and other funds(2) 1,140 0 0 1,140 1,140 0
Fixed-income bond funds(3) 219 00 219 0 219
U.S. government agencies 1,367 2 (3) 1,366 0 1,366
Foreign government bonds 2,242 14 (23) 2,233 0 2,233
Municipal securities 3,812 47 (4) 3,855 0 3,855
Corporate debt securities 13,809 53 (278) 13,584 136 13,448
Agency mortgage-backed
securities 9,680 48 (57) 9,671 0 9,671
Asset-backed securities 3,032 0 (8) 3,024 0 3,024
38,524 164 (373) 38,315 3,288 35,027
Total $ 73,141 $ 346 $ (421) $ 73,066 $ 16,549 $ 56,517
(1) The majority of our time deposits are foreign deposits.
(2) The balances as of December 31, 2014 and 2015 were related to cash collateral received in connection with our securities
lending program, which was invested in reverse repurchase agreements maturing within three months. See section titled
"Securities Lending Program" below for further discussion of this program.
(3) Fixed-income bond funds consist of mutual funds that primarily invest in corporate and government bonds.
We determine realized gains or losses on the marketable securities on a specific identification method. We
recognized gross realized gains of $416 million, $238 million, and $357 million for the years ended December 31,