Google 2015 Annual Report Download - page 119
Download and view the complete annual report
Please find page 119 of the 2015 Google annual report below. You can navigate through the pages in the report by either clicking on the pages listed below, or by using the keyword search tool below to find specific information within the annual report.-
 1
1 -
2
-
3
-
4
-
5
-
6
-
7
-
8
-
9
-
10
-
11
-
12
-
13
-
14
-
15
-
16
-
17
-
18
-
19
-
20
-
21
-
22
-
23
-
24
-
25
-
26
-
27
-
28
-
29
-
30
-
31
-
32
-
33
-
34
-
35
-
36
-
37
-
38
-
39
-
40
-
41
-
42
-
43
-
44
-
45
-
46
-
47
-
48
-
49
-
50
-
51
-
52
-
53
-
54
-
55
-
56
-
57
-
58
-
59
-
60
-
61
-
62
-
63
-
64
-
65
-
66
-
67
-
68
-
69
-
70
-
71
-
72
-
73
-
74
-
75
-
76
-
77
-
78
-
79
-
80
-
81
-
82
-
83
-
84
-
85
-
86
-
87
-
88
-
89
-
90
-
91
-
92
-
93
-
94
-
95
-
96
-
97
-
98
-
99
-
100
-
101
-
102
-
103
-
104
-
105
-
106
-
107
-
108
-
 109
109 -
 110
110 -
 111
111 -
 112
112 -
 113
113 -
 114
114 -
 115
115 -
 116
116 -
 117
117 -
 118
118 -
 119
119 -
 120
120 -
 121
121 -
 122
122 -
 123
123 -
 124
124 -
 125
125 -
 126
126 -
 127
127
 |
 |
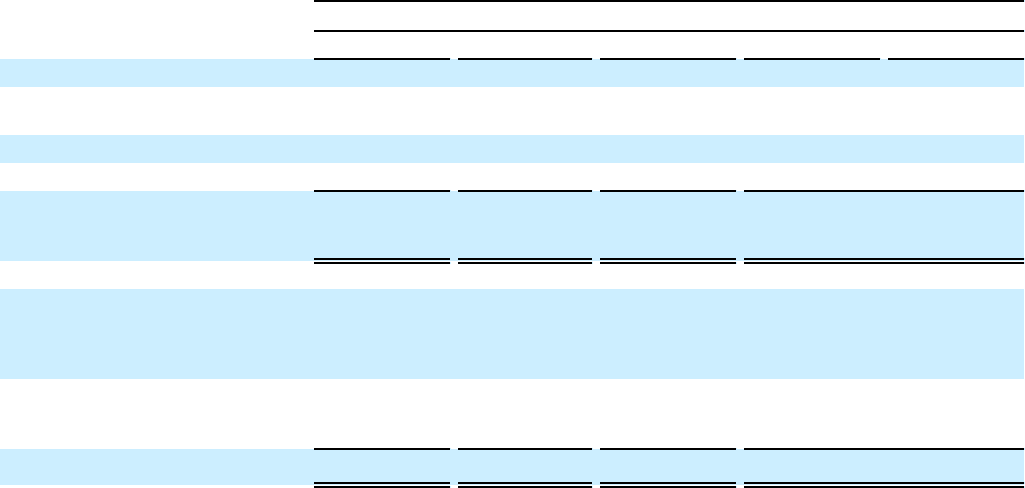
Exhibit 12
COMPUTATION OF RATIO OF EARNINGS TO FIXED CHARGES
Year Ended December 31,
(In millions, except ratios) 2011 2012 2013 2014 2015
Earnings:
Pre-tax income from
continuing operations $ 12,326 $ 14,469 $ 15,899 $ 17,259 $ 19,651
Add:
Fixed charges 185 233 258 307 349
Pre-tax income from
continuing operations
plus fixed charges $ 12,511 $ 14,702 $ 16,157 $ 17,566 $ 20,000
Fixed charges:
Interest expense and
amortization of capitalized
expenses related to
indebtedness $58 $ 84 $ 83 $ 101 $ 104
Estimated interest
component included in rent
expense 127 149 175 206 245
Total fixed charges $ 185 $ 233 $ 258 $ 307 $ 349
Ratio of earnings to fixed
charges 68 63 63 57 57