Google 2015 Annual Report Download - page 34
Download and view the complete annual report
Please find page 34 of the 2015 Google annual report below. You can navigate through the pages in the report by either clicking on the pages listed below, or by using the keyword search tool below to find specific information within the annual report.-
 1
1 -
2
-
3
-
4
-
5
-
6
-
7
-
8
-
9
-
10
-
11
-
12
-
13
-
14
-
15
-
16
-
17
-
18
-
19
-
20
-
21
-
22
-
23
-
 24
24 -
 25
25 -
 26
26 -
 27
27 -
 28
28 -
 29
29 -
 30
30 -
 31
31 -
 32
32 -
 33
33 -
 34
34 -
 35
35 -
 36
36 -
 37
37 -
 38
38 -
 39
39 -
 40
40 -
 41
41 -
 42
42 -
 43
43 -
 44
44 -
45
-
46
-
47
-
48
-
49
-
50
-
51
-
52
-
53
-
54
-
55
-
56
-
57
-
58
-
59
-
60
-
61
-
62
-
63
-
64
-
65
-
66
-
67
-
68
-
69
-
70
-
71
-
72
-
73
-
74
-
75
-
76
-
77
-
78
-
79
-
80
-
81
-
82
-
83
-
84
-
85
-
86
-
87
-
88
-
89
-
90
-
91
-
92
-
93
-
94
-
95
-
96
-
97
-
98
-
99
-
100
-
101
-
102
-
103
-
104
-
105
-
106
-
107
-
108
-
109
-
110
-
111
-
112
-
113
-
114
-
115
-
116
-
117
-
118
-
119
-
120
-
121
-
122
-
123
-
124
-
125
-
126
-
127
 |
 |

Table of Contents Alphabet Inc. and Google Inc.
30
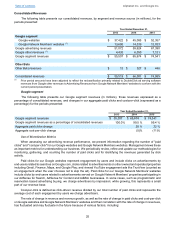
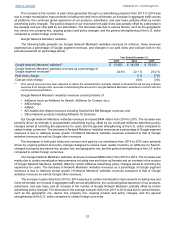
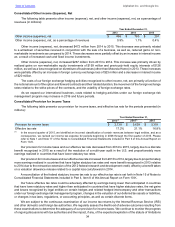
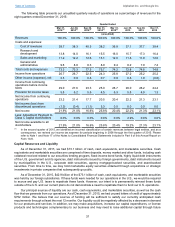
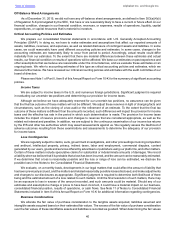
The following table presents our foreign exchange impact on Rest of the world and total revenues for the periods
presented (in millions; unaudited):
Year Ended December 31,
2013 2014 2015
Rest of the world revenues(1) $ 24,332 $ 30,036 $ 33,112
Exclude: Foreign exchange impact on current year revenues using
prior period rates 535 857 5,052
Exclude: Hedging gains recognized (32) (169) (1,267)
Constant currency Rest of the world revenues $ 24,835 $ 30,724 $ 36,897
Rest of the world revenue growth rate 23% 10%
Rest of the world constant currency revenue growth rate 26% 24%
United States revenues(1) $ 25,587 $ 29,482 $ 34,810
United States revenue growth rate 15% 18%
Total consolidated revenues $ 55,519 $ 66,001 $ 74,989
Constant currency total consolidated revenues $ 56,026 $ 66,382 $ 79,179
Total consolidated revenue growth rate 19% 14%
Constant currency total consolidated revenue growth rate 20% 20%
(1) In the second quarter of 2015, we identified an incorrect classification of certain revenues between legal entities. We revised
the classification of such revenues between Rest of the world and U.S. for prior periods. Please refer to Note 1 and Note 17
of the Notes to Consolidated Financial Statements included in Part II of this Annual report t on Form 10-K for further information.
In 2015, our revenues from the Rest of the world (excluding the United Kingdom) were unfavorably impacted by
changes in foreign currency exchange rates, primarily because the U.S. dollar strengthened relative to the Euro,
Brazilian real, Australian dollar and Japanese yen.
In 2014, our revenues from the Rest of the world (excluding the United Kingdom) were unfavorably impacted by
changes in foreign currency exchange rates, as the U.S. dollar strengthened relative to certain currencies, most notably
the Japanese yen and the Australian dollar, and partially offset by the favorable impact of the U.S. dollar weakening
against certain currencies, most notably the Euro.
Consolidated Costs and Expenses
Cost of Revenues
Cost of revenues consists primarily of traffic acquisition costs which are the advertising revenues shared with
our Google Network Members and the amounts paid to our distribution partners who distribute our browser or otherwise
direct search queries to our website.
Additionally, other cost of revenues (which is the cost of revenues excluding traffic acquisition costs) includes
the following:
• The expenses associated with the operation of our data centers (including depreciation, labor, energy, and
bandwidth costs);
• Content acquisition costs primarily related to payments to certain content providers from whom we license
their video and other content for distribution on YouTube and Google Play (we share the fees these sales
generate with content providers or pay a fixed fee to these content providers);
• Credit card and other transaction fees related to processing customer transactions;
• Stock-based compensation expense;
• Revenue share payments to mobile carriers;
• Inventory costs for hardware we sell; and
• Amortization of certain intangible assets.
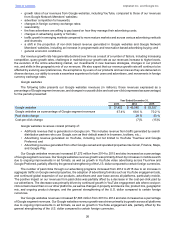
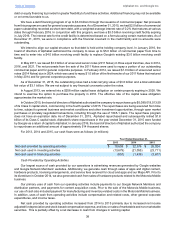
The following tables present our cost of revenues and cost of revenues as a percentage of revenues, and our
traffic acquisition costs and traffic acquisition costs as a percentage of advertising revenues, for the periods presented
(in millions):