Google 2015 Annual Report Download - page 101
Download and view the complete annual report
Please find page 101 of the 2015 Google annual report below. You can navigate through the pages in the report by either clicking on the pages listed below, or by using the keyword search tool below to find specific information within the annual report.-
 1
1 -
2
-
3
-
4
-
5
-
6
-
7
-
8
-
9
-
10
-
11
-
12
-
13
-
14
-
15
-
16
-
17
-
18
-
19
-
20
-
21
-
22
-
23
-
24
-
25
-
26
-
27
-
28
-
29
-
30
-
31
-
32
-
33
-
34
-
35
-
36
-
37
-
38
-
39
-
40
-
41
-
42
-
43
-
44
-
45
-
46
-
47
-
48
-
49
-
50
-
51
-
52
-
53
-
54
-
55
-
56
-
57
-
58
-
59
-
60
-
61
-
62
-
63
-
64
-
65
-
66
-
67
-
68
-
69
-
70
-
71
-
72
-
73
-
74
-
75
-
76
-
77
-
78
-
79
-
80
-
81
-
82
-
83
-
84
-
85
-
86
-
87
-
88
-
89
-
90
-
 91
91 -
 92
92 -
 93
93 -
 94
94 -
 95
95 -
 96
96 -
 97
97 -
 98
98 -
 99
99 -
 100
100 -
 101
101 -
 102
102 -
 103
103 -
 104
104 -
 105
105 -
 106
106 -
 107
107 -
 108
108 -
 109
109 -
 110
110 -
 111
111 -
112
-
113
-
114
-
115
-
116
-
117
-
118
-
119
-
120
-
121
-
122
-
123
-
124
-
125
-
126
-
127
 |
 |

Table of Contents Alphabet Inc. and Google Inc.
97
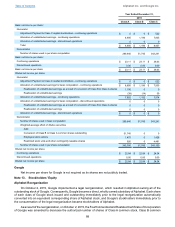
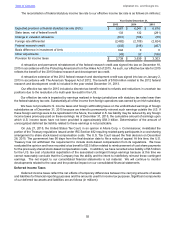
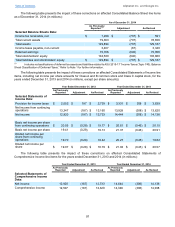
The following table presents the impact of these corrections on affected Consolidated Balance Sheet line items
as of December 31, 2014 (in millions):
As of December 31, 2014
As Previously
Reported (1) Adjustment As Revised
Selected Balance Sheets Data:
Income tax receivable, net $ 1,298 $ (707) $ 591
Total current assets 79,363 (707) 78,656
Total assets 129,894 (707) 129,187
Income taxes payable, non-current 3,407 (67) 3,340
Retained earnings 75,706 (640) 75,066
Total stockholders' equity 104,500 (640) 103,860
Total liabilities and stockholders' equity $ 129,894 $ (707) $ 129,187
(1) Includes reclassifications of deferred tax assets and liabilities related to ASU 2015-17 “Income Taxes (Topic 740): Balance
Sheet Classification of Deferred Taxes.” Refer to Note 1 for further information.
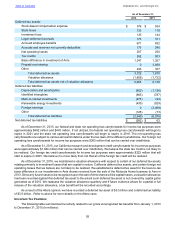
The following table presents the impact of these corrections on affected Consolidated Statements of Income line
items, including net income per share amounts for Class A and B common stock and Class C capital stock, for the
years ended December 31, 2013 and 2014 (in millions, except per share amounts):
Year Ended December 31, 2013 Year Ended December 31, 2014
As Previously
Reported Adjustment As Revised As Previously
Reported Adjustment As Revised
Selected Statements of
Income Data:
Provision for income taxes $ 2,552 $ 187 $ 2,739 $ 3,331 $ 308 $ 3,639
Net income from continuing
operations 13,347 (187) $ 13,160 13,928 (308) $ 13,620
Net income 12,920 (187) $ 12,733 14,444 (308) $ 14,136
Basic net income per share
from continuing operations $20.05 $(0.28) $ 19.77 $ 20.61 $ (0.46) $ 20.15
Basic net income per share 19.41 (0.28) 19.13 21.37 (0.46) 20.91
Diluted net income per
share from continuing
operations 19.70 (0.28) 19.42 20.27 (0.45) 19.82
Diluted net income per
share $19.07 $(0.28) $ 18.79 $ 21.02 $ (0.45) $ 20.57
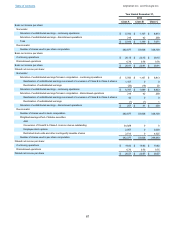
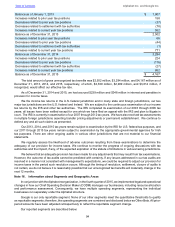
The following table presents the impact of these corrections on affected Consolidated Statements of
Comprehensive Income line items for the years ended December 31, 2013 and 2014 (in millions):
Year Ended December 31, 2013 Year Ended December 31, 2014
As Previously
Reported Adjustment As Revised As Previously
Reported Adjustment As Revised
Selected Statements of
Comprehensive Income
Data:
Net income 12,920 (187) 12,733 14,444 (308) 14,136
Comprehensive income 12,507 (187) 12,320 14,346 (308) 14,038