Google 2015 Annual Report Download - page 52
Download and view the complete annual report
Please find page 52 of the 2015 Google annual report below. You can navigate through the pages in the report by either clicking on the pages listed below, or by using the keyword search tool below to find specific information within the annual report.-
 1
1 -
2
-
3
-
4
-
5
-
6
-
7
-
8
-
9
-
10
-
11
-
12
-
13
-
14
-
15
-
16
-
17
-
18
-
19
-
20
-
21
-
22
-
23
-
24
-
25
-
26
-
27
-
28
-
29
-
30
-
31
-
32
-
33
-
34
-
35
-
36
-
37
-
38
-
39
-
40
-
41
-
 42
42 -
 43
43 -
 44
44 -
 45
45 -
 46
46 -
 47
47 -
 48
48 -
 49
49 -
 50
50 -
 51
51 -
 52
52 -
 53
53 -
 54
54 -
 55
55 -
 56
56 -
 57
57 -
 58
58 -
 59
59 -
 60
60 -
 61
61 -
 62
62 -
63
-
64
-
65
-
66
-
67
-
68
-
69
-
70
-
71
-
72
-
73
-
74
-
75
-
76
-
77
-
78
-
79
-
80
-
81
-
82
-
83
-
84
-
85
-
86
-
87
-
88
-
89
-
90
-
91
-
92
-
93
-
94
-
95
-
96
-
97
-
98
-
99
-
100
-
101
-
102
-
103
-
104
-
105
-
106
-
107
-
108
-
109
-
110
-
111
-
112
-
113
-
114
-
115
-
116
-
117
-
118
-
119
-
120
-
121
-
122
-
123
-
124
-
125
-
126
-
127
 |
 |
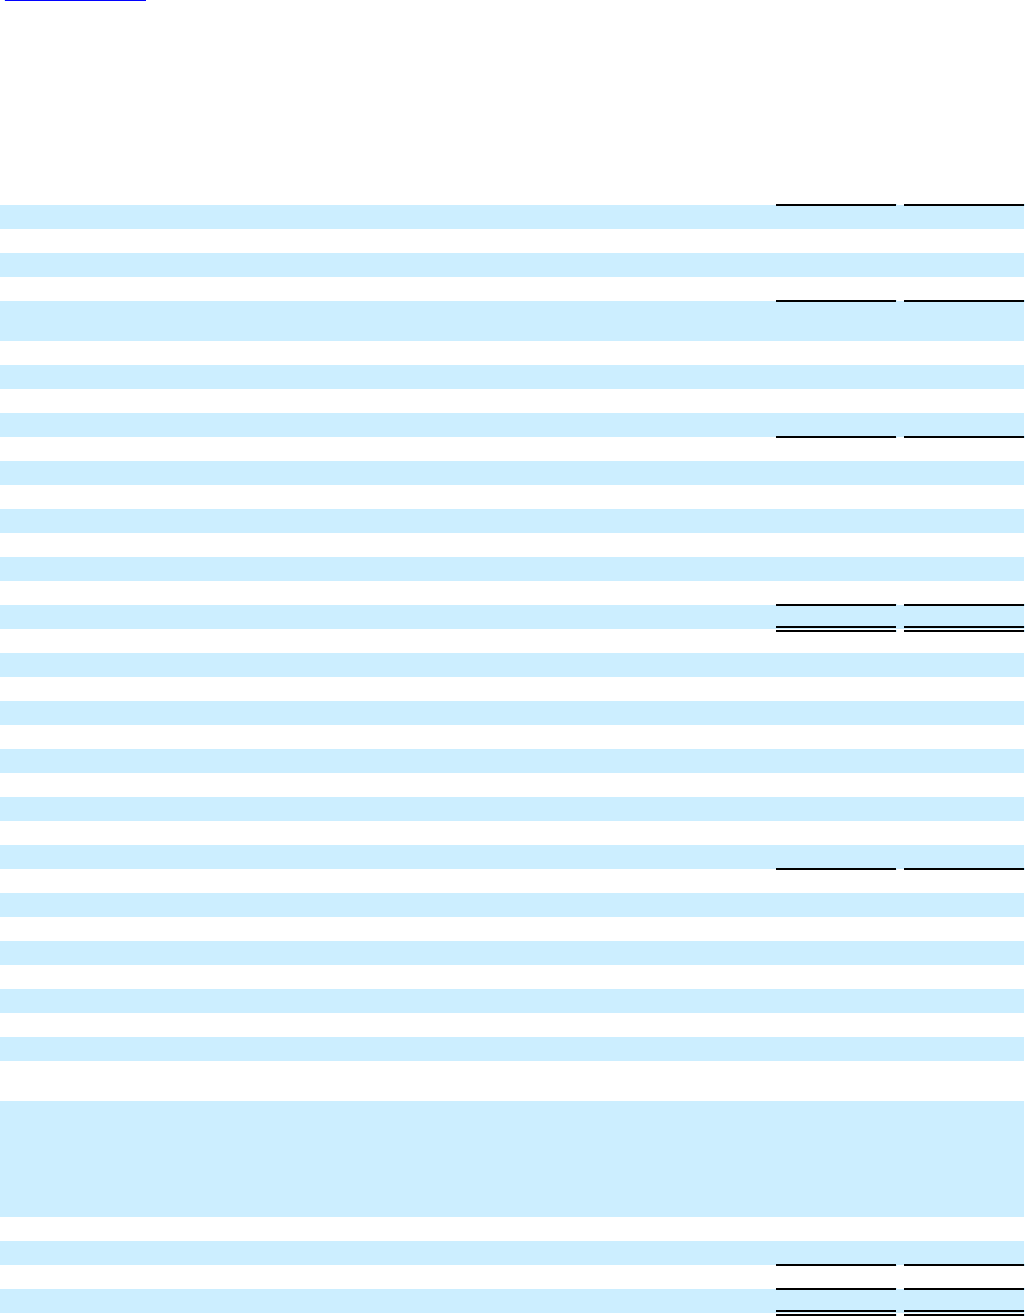
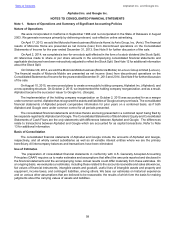
Table of Contents Alphabet Inc. and Google Inc.
48
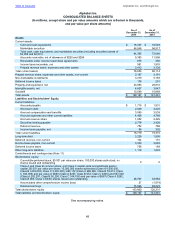
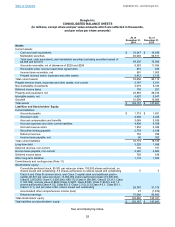
Alphabet Inc.
CONSOLIDATED BALANCE SHEETS
(In millions, except share and par value amounts which are reflected in thousands,
and par value per share amounts)
As of
December 31,
2014
As of
December 31,
2015
Assets
Current assets:
Cash and cash equivalents $ 18,347 $ 16,549
Marketable securities 46,048 56,517
Total cash, cash equivalents, and marketable securities (including securities loaned of
$4,058 and $4,531) 64,395 73,066
Accounts receivable, net of allowance of $225 and $296 9,383 11,556
Receivable under reverse repurchase agreements 875 450
Income taxes receivable, net 591 1,903
Prepaid revenue share, expenses and other assets 3,412 3,139
Total current assets 78,656 90,114
Prepaid revenue share, expenses and other assets, non-current 3,187 3,181
Non-marketable investments 3,079 5,183
Deferred income taxes 176 251
Property and equipment, net 23,883 29,016
Intangible assets, net 4,607 3,847
Goodwill 15,599 15,869
Total assets $ 129,187 $ 147,461
Liabilities and Stockholders’ Equity
Current liabilities:
Accounts payable $ 1,715 $ 1,931
Short-term debt 2,009 3,225
Accrued compensation and benefits 3,069 3,539
Accrued expenses and other current liabilities 4,408 4,768
Accrued revenue share 1,952 2,329
Securities lending payable 2,778 2,428
Deferred revenue 752 788
Income taxes payable, net 96 302
Total current liabilities 16,779 19,310
Long-term debt 3,228 1,995
Deferred revenue, non-current 104 151
Income taxes payable, non-current 3,340 3,663
Deferred income taxes 758 189
Other long-term liabilities 1,118 1,822
Commitments and contingencies (Note 11)
Stockholders’ equity:
Convertible preferred stock, $0.001 par value per share, 100,000 shares authorized; no
shares issued and outstanding 0 0
Class A and Class B common stock, and Class C capital stock and additional paid-in
capital, $0.001 par value per share: 15,000,000 shares authorized (Class A 9,000,000,
Class B 3,000,000, Class C 3,000,000); 680,172 (Class A 286,560, Class B 53,213, Class
C 340,399) and par value of $680 (Class A $287, Class B $53, Class C $340) and 687,348
(Class A 292,297, Class B 50,295, Class C 344,756) and par value of $687 (Class A $292,
Class B $50, Class C $345) shares issued and outstanding 28,767 32,982
Accumulated other comprehensive income (loss) 27 (1,874)
Retained earnings 75,066 89,223
Total stockholders’ equity 103,860 120,331
Total liabilities and stockholders’ equity $ 129,187 $ 147,461
See accompanying notes.