Google 2015 Annual Report Download - page 61
Download and view the complete annual report
Please find page 61 of the 2015 Google annual report below. You can navigate through the pages in the report by either clicking on the pages listed below, or by using the keyword search tool below to find specific information within the annual report.-
 1
1 -
2
-
3
-
4
-
5
-
6
-
7
-
8
-
9
-
10
-
11
-
12
-
13
-
14
-
15
-
16
-
17
-
18
-
19
-
20
-
21
-
22
-
23
-
24
-
25
-
26
-
27
-
28
-
29
-
30
-
31
-
32
-
33
-
34
-
35
-
36
-
37
-
38
-
39
-
40
-
41
-
42
-
43
-
44
-
45
-
46
-
47
-
48
-
49
-
50
-
 51
51 -
 52
52 -
 53
53 -
 54
54 -
 55
55 -
 56
56 -
 57
57 -
 58
58 -
 59
59 -
 60
60 -
 61
61 -
 62
62 -
 63
63 -
 64
64 -
 65
65 -
 66
66 -
 67
67 -
 68
68 -
 69
69 -
 70
70 -
 71
71 -
72
-
73
-
74
-
75
-
76
-
77
-
78
-
79
-
80
-
81
-
82
-
83
-
84
-
85
-
86
-
87
-
88
-
89
-
90
-
91
-
92
-
93
-
94
-
95
-
96
-
97
-
98
-
99
-
100
-
101
-
102
-
103
-
104
-
105
-
106
-
107
-
108
-
109
-
110
-
111
-
112
-
113
-
114
-
115
-
116
-
117
-
118
-
119
-
120
-
121
-
122
-
123
-
124
-
125
-
126
-
127
 |
 |
Table of Contents Alphabet Inc. and Google Inc.
57
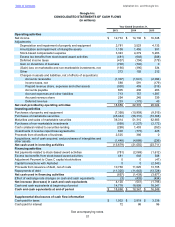
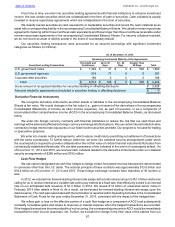
Google Inc.
CONSOLIDATED STATEMENTS OF CASH FLOWS
(In millions)
Year Ended December 31,
2013 2014 2015
Operating activities
Net income $ 12,733 $ 14,136 $ 16,348
Adjustments:
Depreciation and impairment of property and equipment 2,781 3,523 4,132
Amortization and impairment of intangible assets 1,158 1,456 931
Stock-based compensation expense 3,343 4,279 5,203
Excess tax benefits from stock-based award activities (481) (648) (548)
Deferred income taxes (437) (104) (179)
Gain on divestiture of business (700) (740) 0
(Gain) loss on marketable and non-marketable investments, net (166) (390) 334
Other 272 192 212
Changes in assets and liabilities, net of effects of acquisitions:
Accounts receivable (1,307) (1,641) (2,094)
Income taxes, net 588 591 (179)
Prepaid revenue share, expenses and other assets (930) 459 (318)
Accounts payable 605 436 203
Accrued expenses and other liabilities 713 757 1,597
Accrued revenue share 254 245 339
Deferred revenue 233 (175) 43
Net cash provided by operating activities 18,659 22,376 26,024
Investing activities
Purchases of property and equipment (7,358) (10,959) (9,915)
Purchases of marketable securities (45,444) (56,310) (74,368)
Maturities and sales of marketable securities 38,314 51,315 62,905
Purchases of non-marketable investments (569) (1,227) (2,172)
Cash collateral related to securities lending (299) 1,403 (350)
Investments in reverse repurchase agreements 600 (775) 425
Proceeds from divestiture of business 2,525 386 0
Acquisitions, net of cash acquired, and purchases of intangibles and
other assets (1,448) (4,888) (236)
Net cash used in investing activities (13,679) (21,055) (23,711)
Financing activities
Net payments related to stock-based award activities (781) (2,069) (1,612)
Excess tax benefits from stock-based award activities 481 648 548
Adjustment Payment to Class C capital stockholders 0 0 (47)
Capital transactions with Alphabet 0 0 (2,543)
Proceeds from issuance of debt, net of costs 10,768 11,625 13,705
Repayments of debt (11,325) (11,643) (13,728)
Net cash used in financing activities (857) (1,439) (3,677)
Effect of exchange rate changes on cash and cash equivalents (3) (433) (434)
Net increase (decrease) in cash and cash equivalents 4,120 (551) (1,798)
Cash and cash equivalents at beginning of period 14,778 18,898 18,347
Cash and cash equivalents at end of period $ 18,898 $ 18,347 $ 16,549
Supplemental disclosures of cash flow information
Cash paid for taxes $ 1,932 $ 2,819 $ 3,338
Cash paid for interest 72 86 96
See accompanying notes.