Google 2015 Annual Report Download - page 33
Download and view the complete annual report
Please find page 33 of the 2015 Google annual report below. You can navigate through the pages in the report by either clicking on the pages listed below, or by using the keyword search tool below to find specific information within the annual report.-
 1
1 -
2
-
3
-
4
-
5
-
6
-
7
-
8
-
9
-
10
-
11
-
12
-
13
-
14
-
15
-
16
-
17
-
18
-
19
-
20
-
21
-
22
-
 23
23 -
 24
24 -
 25
25 -
 26
26 -
 27
27 -
 28
28 -
 29
29 -
 30
30 -
 31
31 -
 32
32 -
 33
33 -
 34
34 -
 35
35 -
 36
36 -
 37
37 -
 38
38 -
 39
39 -
 40
40 -
 41
41 -
 42
42 -
 43
43 -
44
-
45
-
46
-
47
-
48
-
49
-
50
-
51
-
52
-
53
-
54
-
55
-
56
-
57
-
58
-
59
-
60
-
61
-
62
-
63
-
64
-
65
-
66
-
67
-
68
-
69
-
70
-
71
-
72
-
73
-
74
-
75
-
76
-
77
-
78
-
79
-
80
-
81
-
82
-
83
-
84
-
85
-
86
-
87
-
88
-
89
-
90
-
91
-
92
-
93
-
94
-
95
-
96
-
97
-
98
-
99
-
100
-
101
-
102
-
103
-
104
-
105
-
106
-
107
-
108
-
109
-
110
-
111
-
112
-
113
-
114
-
115
-
116
-
117
-
118
-
119
-
120
-
121
-
122
-
123
-
124
-
125
-
126
-
127
 |
 |

Table of Contents Alphabet Inc. and Google Inc.
29
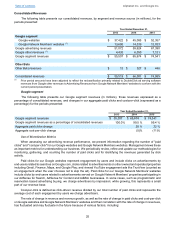
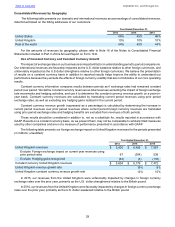
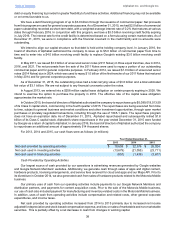
Consolidated Revenues by Geography
The following table presents our domestic and international revenues as a percentage of consolidated revenues,
determined based on the billing addresses of our customers:
Year Ended December 31,
2013 2014 2015
United States 46% 45% 46%
United Kingdom 10% 10% 10%
Rest of the world 44% 45% 44%
For the amounts of revenues by geography, please refer to Note 16 of the Notes to Consolidated Financial
Statements included in Part II of this Annual Report on Form 10-K.
Use of Constant Currency and Constant Currency Growth
The impact of exchange rates on our business is an important factor in understanding period to period comparisons.
Our international revenues are favorably impacted as the U.S. dollar weakens relative to other foreign currencies, and
unfavorably impacted as the U.S dollar strengthens relative to other foreign currencies. We believe the presentation
of results on a constant currency basis in addition to reported results helps improve the ability to understand our
performance because they exclude the effects of foreign currency volatility that are not indicative of our core operating
results.
Constant currency information compares results between periods as if exchange rates had remained constant
period over period. We define constant currency revenues as total revenues excluding the impact of foreign exchange
rate movements and hedging activities, and use it to determine the constant currency revenue growth on a year-on-
year basis. Constant currency revenues are calculated by translating current period revenues using prior period
exchange rates, as well as excluding any hedging gains realized in the current period.
Constant currency revenue growth (expressed as a percentage) is calculated by determining the increase in
current period revenues over prior period revenues where current period foreign currency revenues are translated
using prior period exchange rates and hedging benefits are excluded from revenues of both periods.
These results should be considered in addition to, not as a substitute for, results reported in accordance with
GAAP. Results on a constant currency basis, as we present them, may not be comparable to similarly titled measures
used by other companies and are not a measure of performance presented in accordance with GAAP.
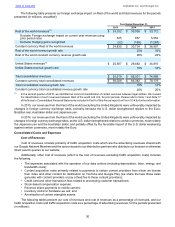
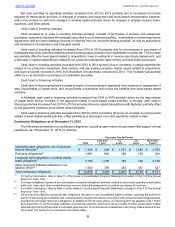
The following table presents our foreign exchange impact on United Kingdom revenues for the periods presented
(in millions; unaudited):
Year Ended December 31,
2013 2014 2015
United Kingdom revenues $ 5,600 $ 6,483 $ 7,067
Exclude: Foreign exchange impact on current year revenues using
prior period rates 67 (304) 538
Exclude: Hedging gains recognized (63) (3) (133)
Constant currency United Kingdom revenues $ 5,604 $ 6,176 $ 7,472
United Kingdom revenue growth rate 16% 9%
United Kingdom constant currency revenue growth rate 12% 15%
In 2015, our revenues from the United Kingdom were unfavorably impacted by changes in foreign currency
exchange rates over the prior year, primarily as the U.S. dollar strengthened relative to the British pound.
In 2014, our revenues from the United Kingdom were favorably impacted by changes in foreign currency exchange
rates over the prior year, primarily as the U.S. dollar weakened relative to the British pound.