Google 2015 Annual Report Download - page 65
Download and view the complete annual report
Please find page 65 of the 2015 Google annual report below. You can navigate through the pages in the report by either clicking on the pages listed below, or by using the keyword search tool below to find specific information within the annual report.-
 1
1 -
2
-
3
-
4
-
5
-
6
-
7
-
8
-
9
-
10
-
11
-
12
-
13
-
14
-
15
-
16
-
17
-
18
-
19
-
20
-
21
-
22
-
23
-
24
-
25
-
26
-
27
-
28
-
29
-
30
-
31
-
32
-
33
-
34
-
35
-
36
-
37
-
38
-
39
-
40
-
41
-
42
-
43
-
44
-
45
-
46
-
47
-
48
-
49
-
50
-
51
-
52
-
53
-
54
-
 55
55 -
 56
56 -
 57
57 -
 58
58 -
 59
59 -
 60
60 -
 61
61 -
 62
62 -
 63
63 -
 64
64 -
 65
65 -
 66
66 -
 67
67 -
 68
68 -
 69
69 -
 70
70 -
 71
71 -
 72
72 -
 73
73 -
 74
74 -
 75
75 -
76
-
77
-
78
-
79
-
80
-
81
-
82
-
83
-
84
-
85
-
86
-
87
-
88
-
89
-
90
-
91
-
92
-
93
-
94
-
95
-
96
-
97
-
98
-
99
-
100
-
101
-
102
-
103
-
104
-
105
-
106
-
107
-
108
-
109
-
110
-
111
-
112
-
113
-
114
-
115
-
116
-
117
-
118
-
119
-
120
-
121
-
122
-
123
-
124
-
125
-
126
-
127
 |
 |

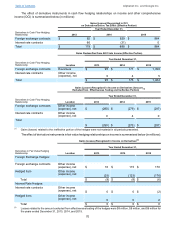
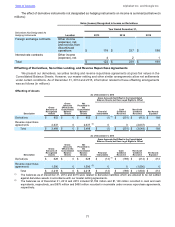
Table of Contents Alphabet Inc. and Google Inc.
61
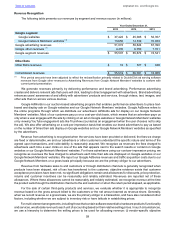
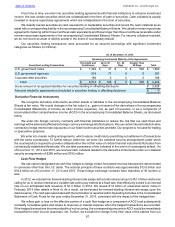
Accounts receivable are typically unsecured and are derived from revenues earned from customers located around
the world. In 2013, 2014, and 2015, we generated approximately 46%, 45%, and 46% of our revenues from customers
based in the U.S., with the majority of revenues from customers outside of the U.S. located in Europe and Japan. We
perform ongoing evaluations to determine customer credit and we limit the amount of credit we extend, but generally
we do not require collateral from our customers. We maintain reserves for estimated credit losses and these losses
have generally been within our expectations.
No individual customer or groups of affiliated customers represented more than 10% of our revenues in 2013,
2014, or 2015.
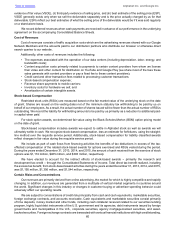
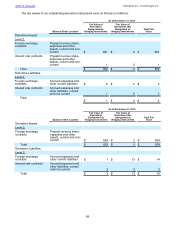
Fair Value of Financial Instruments
Our financial assets and financial liabilities that include cash equivalents, marketable securities, foreign currency
and interest rate derivative contracts, and non-marketable debt securities are measured and recorded at fair value on
a recurring basis. We measure certain financial assets at fair value for disclosure purposes, as well as, on a nonrecurring
basis when they are deemed to be other-than-temporarily impaired. Our other current financial assets and our other
current financial liabilities have fair values that approximate their carrying value.
Fair value is an exit price, representing the amount that would be received to sell an asset or paid to transfer a
liability in an orderly transaction between market participants. As such, fair value is a market-based measurement that
is determined based on assumptions that market participants would use in pricing an asset or a liability. Assets and
liabilities recorded at fair value are measured and classified in accordance with a three-tier fair value hierarchy based
on the observability of the inputs available in the market used to measure fair value:
Level 1 - Observable inputs that reflect quoted prices (unadjusted) for identical assets or liabilities in active
markets.
Level 2 - Include other inputs that are based upon quoted prices for similar instruments in active markets, quoted
prices for identical or similar instruments in markets that are not active, and model-based valuation techniques
for which all significant inputs are observable in the market or can be derived from observable market data. Where
applicable, these models project future cash flows and discount the future amounts to a present value using
market-based observable inputs including interest rate curves, foreign exchange rates, and credit ratings.
Level 3 - Unobservable inputs that are supported by little or no market activities.
The fair value hierarchy requires an entity to maximize the use of observable inputs and minimize the use of
unobservable inputs when measuring fair value.
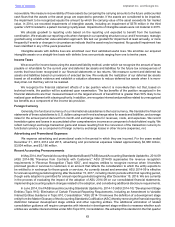
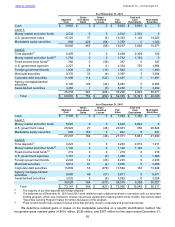
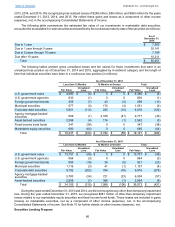
Cash, Cash Equivalents, and Marketable Securities
We invest all excess cash primarily in debt securities including those of the U.S. government and its agencies,
corporate debt securities, agency mortgage-backed securities, money market and other funds, municipal securities,
time deposits, asset backed securities, and debt instruments issued by foreign governments.
We classify all investments that are readily convertible to known amounts of cash and have stated maturities of
three months or less from the date of purchase as cash equivalents and those with stated maturities of greater than
three months as marketable securities.
We determine the appropriate classification of our investments in marketable securities at the time of purchase
and reevaluate such designation at each balance sheet date. We have classified and accounted for our marketable
securities as available-for-sale. After consideration of our risk versus reward objectives, as well as our liquidity
requirements, we may sell these securities prior to their stated maturities. As we view these securities as available to
support current operations, we classify highly liquid securities with maturities beyond 12 months as current assets
under the caption marketable securities in the accompanying Consolidated Balance Sheets. We carry these securities
at fair value, and report the unrealized gains and losses, net of taxes, as a component of stockholders’ equity, except
for unrealized losses determined to be other-than-temporary, which we record within other income (expense), net. We
determine any realized gains or losses on the sale of marketable securities on a specific identification method, and
we record such gains and losses as a component of other income (expense), net.
Non-Marketable Investments
We have accounted for non-marketable equity investments either under the equity or cost method. Investments
through which we exercise significant influence but do not have control over the investee are accounted for under the
equity method. Investments through which we are not able to exercise significant influence over the investee are
accounted for under the cost method.