Google 2015 Annual Report Download - page 26
Download and view the complete annual report
Please find page 26 of the 2015 Google annual report below. You can navigate through the pages in the report by either clicking on the pages listed below, or by using the keyword search tool below to find specific information within the annual report.-
 1
1 -
2
-
3
-
4
-
5
-
6
-
7
-
8
-
9
-
10
-
11
-
12
-
13
-
14
-
15
-
 16
16 -
 17
17 -
 18
18 -
 19
19 -
 20
20 -
 21
21 -
 22
22 -
 23
23 -
 24
24 -
 25
25 -
 26
26 -
 27
27 -
 28
28 -
 29
29 -
 30
30 -
 31
31 -
 32
32 -
 33
33 -
 34
34 -
 35
35 -
 36
36 -
37
-
38
-
39
-
40
-
41
-
42
-
43
-
44
-
45
-
46
-
47
-
48
-
49
-
50
-
51
-
52
-
53
-
54
-
55
-
56
-
57
-
58
-
59
-
60
-
61
-
62
-
63
-
64
-
65
-
66
-
67
-
68
-
69
-
70
-
71
-
72
-
73
-
74
-
75
-
76
-
77
-
78
-
79
-
80
-
81
-
82
-
83
-
84
-
85
-
86
-
87
-
88
-
89
-
90
-
91
-
92
-
93
-
94
-
95
-
96
-
97
-
98
-
99
-
100
-
101
-
102
-
103
-
104
-
105
-
106
-
107
-
108
-
109
-
110
-
111
-
112
-
113
-
114
-
115
-
116
-
117
-
118
-
119
-
120
-
121
-
122
-
123
-
124
-
125
-
126
-
127
 |
 |
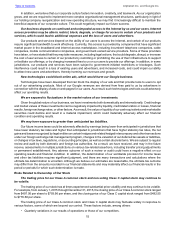
Table of Contents Alphabet Inc. and Google Inc.
22
The consolidated balance sheets of Alphabet and Google were as follows for the periods presented:
As of December 31,
2011(1)(2) 2012(1)(2) 2013(1)(2) 2014(1)(2) 2015
(in millions)
Consolidated Balance Sheet Data:
Cash, cash equivalents, and marketable
securities $44,626 $ 48,088 $ 58,717 $ 64,395 $ 73,066
Total assets 72,359 92,711 109,050 129,187 147,461
Total long-term liabilities 5,294 6,662 6,165 8,548 7,820
Total stockholders’ equity 58,118 71,570 86,977 103,860 120,331
(1) In the second quarter of 2015, we identified an incorrect classification of certain revenues between legal entities, and as a
consequence, we revised our income tax expense for periods beginning in 2008 through the first quarter of 2015. Please
refer to Note 1 and Note 17 of the Notes to Consolidated Financial Statements included in Part II of this Annual Report on
Form 10-K.
(2) Includes reclassifications of deferred tax assets and liabilities related to ASU 2015-17 “Income Taxes (Topic 740): Balance
Sheet Classification of Deferred Taxes.” Please refer to Note 1 of the Notes to Consolidated Financial Statements included
in Part II of this Annual Report on Form 10-K.
ITEM 7. MANAGEMENT’S DISCUSSION AND ANALYSIS OF FINANCIAL CONDITION AND RESULTS OF
OPERATIONS
Please read the following discussion and analysis of our financial condition and results of operations together
with our consolidated financial statements and related notes included under Item 8 of this Annual Report on Form 10-
K.
Trends in Our Business
The following trends have contributed to the results of our consolidated operations, and we anticipate that they
will continue to impact our future results:
• Users' behaviors and advertising continue to shift online as the digital economy evolves.
The continuing shift from an offline to online world has contributed to the growth of our business since inception,
resulting in increasing revenues, and we expect that this online shift will continue to benefit our business.
• As online advertising evolves, we continue to expand our product offerings which may impact our
monetization.
As interactions between users and advertisers change, we continue to expand our product offerings to serve their
changing needs. Over time, we expect our monetization trends to fluctuate. For example, we have seen an increase
in YouTube engagement ads, which monetize at a lower rate than traditional search desktop ads. Additionally,
advertisers are beginning to shift to programmatic buying which presents opportunities for advertisers to connect with
the right user, in the right moment, in the right context. This may also have different monetization profiles to our existing
advertising business. These trends will continue to affect our monetization in the future.
• Users are increasingly using multiple devices to access our products and services, and our advertising
revenues are increasingly coming from mobile phones and other new formats.
Our users are accessing the Internet via multiple devices. Mobile computing power continues to grow and users
want to feel connected no matter where they are or what they are doing. We seek to expand our products and services
to stay in front of this shift in order to maintain and grow our business.
In this multi-device world, we generate our advertising revenues increasingly from mobile phones and newer
advertising formats, and the margins from the advertising revenues from these sources have generally been lower
than those from desktop computers and tablets. Our traffic acquisition cost (TAC) may also be impacted because the
rates at which we share mobile revenues with our partners may differ from our traditional desktop and tablet formats.
We expect both of these trends to continue to put pressure on our overall margins, particularly if we fail to realize the
opportunities presented during the transition to a dynamic multi-screen environment.
• As users in developing economies increasingly come online, we generate increasing revenues from
international markets, and movements in foreign exchange rates impact such revenues.