Google 2015 Annual Report Download - page 32
Download and view the complete annual report
Please find page 32 of the 2015 Google annual report below. You can navigate through the pages in the report by either clicking on the pages listed below, or by using the keyword search tool below to find specific information within the annual report.-
 1
1 -
2
-
3
-
4
-
5
-
6
-
7
-
8
-
9
-
10
-
11
-
12
-
13
-
14
-
15
-
16
-
17
-
18
-
19
-
20
-
21
-
 22
22 -
 23
23 -
 24
24 -
 25
25 -
 26
26 -
 27
27 -
 28
28 -
 29
29 -
 30
30 -
 31
31 -
 32
32 -
 33
33 -
 34
34 -
 35
35 -
 36
36 -
 37
37 -
 38
38 -
 39
39 -
 40
40 -
 41
41 -
 42
42 -
43
-
44
-
45
-
46
-
47
-
48
-
49
-
50
-
51
-
52
-
53
-
54
-
55
-
56
-
57
-
58
-
59
-
60
-
61
-
62
-
63
-
64
-
65
-
66
-
67
-
68
-
69
-
70
-
71
-
72
-
73
-
74
-
75
-
76
-
77
-
78
-
79
-
80
-
81
-
82
-
83
-
84
-
85
-
86
-
87
-
88
-
89
-
90
-
91
-
92
-
93
-
94
-
95
-
96
-
97
-
98
-
99
-
100
-
101
-
102
-
103
-
104
-
105
-
106
-
107
-
108
-
109
-
110
-
111
-
112
-
113
-
114
-
115
-
116
-
117
-
118
-
119
-
120
-
121
-
122
-
123
-
124
-
125
-
126
-
127
 |
 |

Table of Contents Alphabet Inc. and Google Inc.
28
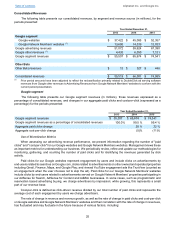
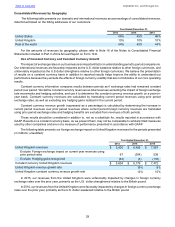
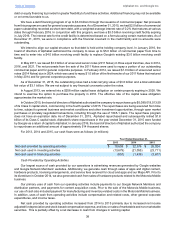
Google other revenues
The following table presents our Google other revenues (in millions), and those revenues expressed as a
percentage of Google segment revenues, for the periods presented:
Year Ended December 31,
2013 2014 2015
Google other revenues(1) $ 4,435 $ 6,050 $ 7,151
Google other revenues as a percentage of Google segment revenues(1) 8.0% 9.3% 9.6%
(1) Prior period amounts have been adjusted to reflect the reclassification primarily related to DoubleClick ad serving software
revenues from Google other revenues to Advertising Revenues from Google Network Members' websites to conform with the
current period presentation.
Google other revenues consist primarily of:
• Sales of apps and media content in the Google Play store;
• Sales of certain Google branded hardware, such as Chromecast;
• Service fees received for cloud and apps and our Maps API; and
• Licensing-related revenue.
Google other revenues increased $1,101 million from 2014 to 2015 and increased as a percentage of Google
segment revenues. These increases were primarily due to the growth of our sales of digital content products in the
Google Play store, primarily apps (revenues which we recognize net of payout to partners). In addition, there was an
increase in revenues from service fees received for cloud and apps offerings. These increases were partially offset by
the general strengthening of the U.S. dollar compared to certain foreign currencies.
Google other revenues increased $1,615 million from 2013 to 2014 and increased as a percentage of Google
segment revenues. The increase was primarily due to growth of our sales of digital content products in the Google
Play store, primarily apps.
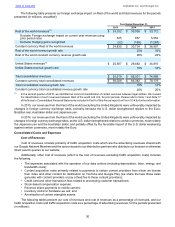
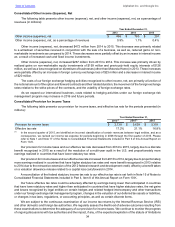
Other Bets
The following table presents our Other Bets revenues (in millions), and those revenues expressed as a percentage
of consolidated revenues, for the periods presented:
Year Ended December 31,
2013 2014 2015
Other Bets revenues $ 12 $ 327 $ 448
Other Bets revenues as a percentage of consolidated revenues 0.0% 0.5% 0.6%
Other Bets revenues consist primarily of:
• Sales of Nest branded hardware;
• Revenues from internet and TV services; and
• Revenues from licensing and R&D services.
Our Other Bets revenues increased $121 million from 2014 to 2015 and remained relatively flat as a percentage
of consolidated revenues. The increase was primarily due to increases in revenues from sales of Nest branded hardware
and revenues from internet and TV services, partially offset by a decrease in licensing revenues. As Nest was acquired
in February 2014, the increase in our Nest revenues is impacted by a partial year of revenues in 2014 as compared
to a full year in 2015.
Our Other Bets revenues increased $315 million from 2013 to 2014 and increased as a percentage of consolidated
revenues. This is primarily due to the acquisition of Nest in 2014 as well as an increase of licensing revenues.