Google 2015 Annual Report Download - page 30
Download and view the complete annual report
Please find page 30 of the 2015 Google annual report below. You can navigate through the pages in the report by either clicking on the pages listed below, or by using the keyword search tool below to find specific information within the annual report.-
 1
1 -
2
-
3
-
4
-
5
-
6
-
7
-
8
-
9
-
10
-
11
-
12
-
13
-
14
-
15
-
16
-
17
-
18
-
19
-
 20
20 -
 21
21 -
 22
22 -
 23
23 -
 24
24 -
 25
25 -
 26
26 -
 27
27 -
 28
28 -
 29
29 -
 30
30 -
 31
31 -
 32
32 -
 33
33 -
 34
34 -
 35
35 -
 36
36 -
 37
37 -
 38
38 -
 39
39 -
 40
40 -
41
-
42
-
43
-
44
-
45
-
46
-
47
-
48
-
49
-
50
-
51
-
52
-
53
-
54
-
55
-
56
-
57
-
58
-
59
-
60
-
61
-
62
-
63
-
64
-
65
-
66
-
67
-
68
-
69
-
70
-
71
-
72
-
73
-
74
-
75
-
76
-
77
-
78
-
79
-
80
-
81
-
82
-
83
-
84
-
85
-
86
-
87
-
88
-
89
-
90
-
91
-
92
-
93
-
94
-
95
-
96
-
97
-
98
-
99
-
100
-
101
-
102
-
103
-
104
-
105
-
106
-
107
-
108
-
109
-
110
-
111
-
112
-
113
-
114
-
115
-
116
-
117
-
118
-
119
-
120
-
121
-
122
-
123
-
124
-
125
-
126
-
127
 |
 |

Table of Contents Alphabet Inc. and Google Inc.
26
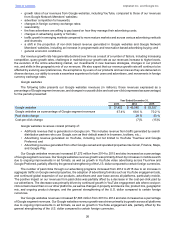
• growth rates of our revenues from Google websites, including YouTube, compared to those of our revenues
from Google Network Members' websites;
• advertiser competition for keywords;
• changes in foreign currency exchange rates;
• seasonality;
• the fees advertisers are willing to pay based on how they manage their advertising costs;
• changes in advertising quality or formats;
• traffic growth in emerging markets compared to more mature markets and across various advertising verticals
and channels;
• a shift in the proportion of non-click based revenue generated in Google websites and Google Network
Members' websites, including an increase in programmatic and reservation based advertising buying; and
• general economic conditions.
Our revenue growth rate has generally declined over time as a result of a number of factors, including increasing
competition, query growth rates, challenges in maintaining our growth rate as our revenues increase to higher levels,
the evolution of the online advertising market, our investments in new business strategies, changes in our product
mix, and shifts in the geographic mix of our revenues. We also expect that our revenue growth rate will continue to be
affected by evolving user preferences, the acceptance by users of our products and services as they are delivered on
diverse devices, our ability to create a seamless experience for both users and advertisers, and movements in foreign
currency exchange rates.
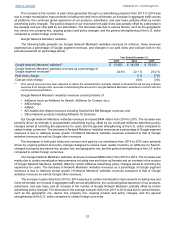
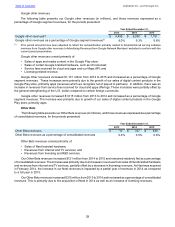
Google websites
The following table presents our Google websites revenues (in millions), those revenues expressed as a
percentage of Google segment revenues, and changes in our paid clicks and cost-per-click (expressed as a percentage)
for the periods presented:
Year Ended December 31,
2013 2014 2015
Google websites $ 37,422 $ 45,085 $ 52,357
Google websites as a percentage of Google segment revenues 67.4% 68.6 % 70.2 %
Paid clicks change 29 % 33 %
Cost-per-click change (7)% (15)%
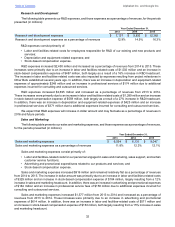
Google websites revenues consist primarily of:
• AdWords revenue that is generated on Google.com. This includes revenue from traffic generated by search
distribution partners who use Google.com as their default search in browsers, toolbars, etc.;
• Advertising revenue generated on YouTube, including, but not limited to YouTube TrueView and Google
Preferred; and
• Advertising revenue generated from other Google owned and operated properties like Gmail, Finance, Maps,
and Google Play.
Our Google websites revenues increased $7,272 million from 2014 to 2015 and also increased as a percentage
of Google segment revenues. Our Google websites revenue growth was primarily driven by increases in mobile search
due to ongoing improvements in ad formats, as well as growth in YouTube video advertising across TrueView and
Google Preferred, partially offset by the general strengthening of the U.S. dollar compared to certain foreign currencies.
The number of paid clicks through our advertising programs increased from 2014 to 2015 due to an increase in
aggregate traffic on Google owned properties, the adoption of advertising formats such as YouTube engagement ads,
and continued global expansion of our products, advertisers and user base across all platforms, particularly mobile.
The positive impact on our revenues from paid clicks was partially offset by a decrease in the cost-per-click paid by
our advertisers. The decrease was primarily driven by continued growth in YouTube engagement ads where cost-per-
click remains lower than on our other platforms, as well as changes in property and device mix, product mix, geographic
mix, and ongoing product changes, and the general strengthening of the U.S. dollar compared to certain foreign
currencies.
Our Google websites revenues increased $7,663 million from 2013 to 2014 and also increased as a percentage
of Google segment revenues. Our Google websites revenue growth was driven primarily by growth across all platforms
due to ongoing improvements in ad formats, as well as growth in YouTube engagement ads, partially offset by the
general strengthening of the U.S. dollar compared to certain foreign currencies.