Humana 2008 Annual Report Download - page 109
Download and view the complete annual report
Please find page 109 of the 2008 Humana annual report below. You can navigate through the pages in the report by either clicking on the pages listed below, or by using the keyword search tool below to find specific information within the annual report.-
 1
1 -
2
-
3
-
4
-
5
-
6
-
7
-
8
-
9
-
10
-
11
-
12
-
13
-
14
-
15
-
16
-
17
-
18
-
19
-
20
-
21
-
22
-
23
-
24
-
25
-
26
-
27
-
28
-
29
-
30
-
31
-
32
-
33
-
34
-
35
-
36
-
37
-
38
-
39
-
40
-
41
-
42
-
43
-
44
-
45
-
46
-
47
-
48
-
49
-
50
-
51
-
52
-
53
-
54
-
55
-
56
-
57
-
58
-
59
-
60
-
61
-
62
-
63
-
64
-
65
-
66
-
67
-
68
-
69
-
70
-
71
-
72
-
73
-
74
-
75
-
76
-
77
-
78
-
79
-
80
-
81
-
82
-
83
-
84
-
85
-
86
-
87
-
88
-
89
-
90
-
91
-
92
-
93
-
94
-
95
-
96
-
97
-
98
-
 99
99 -
 100
100 -
 101
101 -
 102
102 -
 103
103 -
 104
104 -
 105
105 -
 106
106 -
 107
107 -
 108
108 -
 109
109 -
 110
110 -
 111
111 -
 112
112 -
 113
113 -
 114
114 -
 115
115 -
 116
116 -
 117
117 -
 118
118 -
 119
119 -
120
-
121
-
122
-
123
-
124
-
125
-
126
-
127
-
128
-
129
-
130
-
131
-
132
-
133
-
134
-
135
-
136
 |
 |

Humana Inc.
NOTES TO CONSOLIDATED FINANCIAL STATEMENTS—(Continued)
segments. Members served by our two segments often utilize the same provider networks, in some instances
enabling us to obtain more favorable contract terms with providers. Our segments also share indirect overhead
costs and assets. As a result, the profitability of each segment is interdependent.
Our segment results were as follows for the years ended December 31, 2008, 2007, and 2006:
Government Segment
2008 2007 2006
(in thousands)
Revenues:
Premiums:
Medicare Advantage .............................. $13,777,999 $11,173,417 $ 8,499,064
Medicare stand-alone PDP ......................... 3,380,400 3,668,425 3,050,304
Total Medicare .............................. 17,158,399 14,841,842 11,549,368
Military services ................................. 3,218,270 2,839,790 2,543,930
Medicaid ....................................... 591,535 555,594 520,520
Total premiums .............................. 20,968,204 18,237,226 14,613,818
Administrative services fees ............................ 85,868 73,659 49,442
Investment income ................................... 115,162 182,616 116,075
Other revenue ....................................... 1,782 1,705 1,783
Total revenues ............................... 21,171,016 18,495,206 14,781,118
Operating expenses:
Benefits ............................................ 18,007,907 15,279,610 12,424,047
Selling, general and administrative ....................... 2,223,153 2,042,249 1,730,243
Depreciation and amortization .......................... 124,094 108,291 85,071
Total operating expenses ....................... 20,355,154 17,430,150 14,239,361
Income from operations ................................... 815,862 1,065,056 541,757
Interest expense .......................................... 30,622 37,525 27,912
Income before income taxes ................................ $ 785,240 $ 1,027,531 $ 513,845
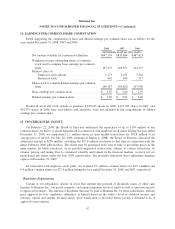
Premium and administrative services revenues derived from our contracts with the federal government, as a
percentage of our total premium and ASO revenues, were approximately 72% for 2008, 71% for 2007 and 67%
for 2006.
99