Humana 2008 Annual Report Download - page 54
Download and view the complete annual report
Please find page 54 of the 2008 Humana annual report below. You can navigate through the pages in the report by either clicking on the pages listed below, or by using the keyword search tool below to find specific information within the annual report.-
 1
1 -
2
-
3
-
4
-
5
-
6
-
7
-
8
-
9
-
10
-
11
-
12
-
13
-
14
-
15
-
16
-
17
-
18
-
19
-
20
-
21
-
22
-
23
-
24
-
25
-
26
-
27
-
28
-
29
-
30
-
31
-
32
-
33
-
34
-
35
-
36
-
37
-
38
-
39
-
40
-
41
-
42
-
43
-
 44
44 -
 45
45 -
 46
46 -
 47
47 -
 48
48 -
 49
49 -
 50
50 -
 51
51 -
 52
52 -
 53
53 -
 54
54 -
 55
55 -
 56
56 -
 57
57 -
 58
58 -
 59
59 -
 60
60 -
 61
61 -
 62
62 -
 63
63 -
 64
64 -
65
-
66
-
67
-
68
-
69
-
70
-
71
-
72
-
73
-
74
-
75
-
76
-
77
-
78
-
79
-
80
-
81
-
82
-
83
-
84
-
85
-
86
-
87
-
88
-
89
-
90
-
91
-
92
-
93
-
94
-
95
-
96
-
97
-
98
-
99
-
100
-
101
-
102
-
103
-
104
-
105
-
106
-
107
-
108
-
109
-
110
-
111
-
112
-
113
-
114
-
115
-
116
-
117
-
118
-
119
-
120
-
121
-
122
-
123
-
124
-
125
-
126
-
127
-
128
-
129
-
130
-
131
-
132
-
133
-
134
-
135
-
136
 |
 |
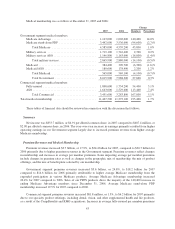
were offset by a decrease in average fully-insured membership. Average fully-insured group membership
decreased 6.9% for 2007 compared to 2006, primarily as a result of a large group account moving from fully-
insured to ASO on July 1, 2006, partially offset by membership gains in strategic areas of commercial growth
including Smart plans and other consumer offerings, individual, and small group product lines. Average per
member premiums for our fully-insured group medical members increased approximately 5.2% from 2006 to
2007.
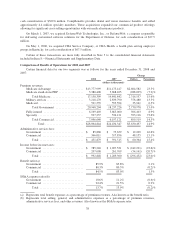
Administrative Services Fees
Our administrative services fees were $391.5 million for 2007, an increase of $50.3 million, or 14.7%, from
$341.2 million for 2006. The increase was due to increases in both our Government and Commercial segments.
For the Government segment, administrative services fees increased $24.2 million, or 49.0%, to $73.7
million for 2007 as a result of the DefenseWeb acquisition and the award of a new Puerto Rico ASO contract
during the fourth quarter of 2006.
For the Commercial segment, administrative services fees increased $26.1 million, or 8.9%, from $291.8
million for 2006 to $317.9 million for 2007 primarily from higher average ASO membership, increasing 5.7%
for 2007 compared to 2006.
Investment Income
Investment income totaled $314.2 million for 2007, an increase of $22.3 million from $291.9 million for
2006 primarily due to higher average investment balances in 2007 partially offset by a decrease in realized gains
related to the sale of venture capital investments in 2006. Investment income for 2006 included a $51.7 million
realized gain related to the sale of a venture capital investment in the first quarter.
Other Revenue
Other revenue totaled $149.9 million for 2007, an increase of $95.6 million from $54.3 million for 2006.
The increase primarily was attributable to increased revenue from growth related to RightSourceRxSM, our mail-
order pharmacy.
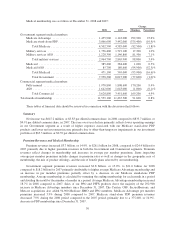
Benefit Expense
Consolidated benefit expense was $20.3 billion for 2007, an increase of $2.9 billion, or 16.7%, from $17.4
billion for 2006. The increase primarily was driven by the increase in the average number of Medicare members
and an increase in average per member claims costs primarily from the effects of health care inflation.
The consolidated benefit ratio for 2007 was 83.0%, a 100 basis point decrease from 84.0% for 2006. The
decrease primarily was attributable to improvements in the benefit ratio for both the Commercial and
Government segments as described below.
The Government segment’s benefit expenses increased $2.9 billion, or 23.0%, during 2007 compared to
2006 primarily due to an increase in the average number of Medicare members, including those enrolled in our
PDPs, and to a lesser extent, an increase in average per member claims costs.
The Government segment’s benefit ratio for 2007 was 83.8%, a 120 basis point decrease from 2006 of
85.0%. The decrease in the benefit ratio resulted from the combination of the extended enrollment period in
2006, improvement in the stand-alone PDP Complete plan, changes in estimates associated with our 2006
Medicare Part D reconciliation with CMS as well as the settlement of some TRICARE contractual provisions
related to prior years. Part D benefit designs result in us sharing a greater portion of the responsibilities for total
44