Humana 2008 Annual Report Download - page 14
Download and view the complete annual report
Please find page 14 of the 2008 Humana annual report below. You can navigate through the pages in the report by either clicking on the pages listed below, or by using the keyword search tool below to find specific information within the annual report.-
 1
1 -
2
-
3
-
 4
4 -
 5
5 -
 6
6 -
 7
7 -
 8
8 -
 9
9 -
 10
10 -
 11
11 -
 12
12 -
 13
13 -
 14
14 -
 15
15 -
 16
16 -
 17
17 -
 18
18 -
 19
19 -
 20
20 -
 21
21 -
 22
22 -
 23
23 -
 24
24 -
25
-
26
-
27
-
28
-
29
-
30
-
31
-
32
-
33
-
34
-
35
-
36
-
37
-
38
-
39
-
40
-
41
-
42
-
43
-
44
-
45
-
46
-
47
-
48
-
49
-
50
-
51
-
52
-
53
-
54
-
55
-
56
-
57
-
58
-
59
-
60
-
61
-
62
-
63
-
64
-
65
-
66
-
67
-
68
-
69
-
70
-
71
-
72
-
73
-
74
-
75
-
76
-
77
-
78
-
79
-
80
-
81
-
82
-
83
-
84
-
85
-
86
-
87
-
88
-
89
-
90
-
91
-
92
-
93
-
94
-
95
-
96
-
97
-
98
-
99
-
100
-
101
-
102
-
103
-
104
-
105
-
106
-
107
-
108
-
109
-
110
-
111
-
112
-
113
-
114
-
115
-
116
-
117
-
118
-
119
-
120
-
121
-
122
-
123
-
124
-
125
-
126
-
127
-
128
-
129
-
130
-
131
-
132
-
133
-
134
-
135
-
136
 |
 |

aggregation provisions of Statement of Financial Accounting Standards (SFAS) No. 131, Disclosures About
Segments of an Enterprise and Related Information, or SFAS 131,which aggregates products with similar
economic characteristics. These characteristics include the nature of customer groups as well as pricing, benefits,
and underwriting requirements. These segment groupings are consistent with information used by our Chief
Executive Officer.
The results of each segment are measured by income before income taxes. We allocate all selling, general
and administrative expenses, investment and other revenue, interest expense, and goodwill, but no other assets or
liabilities, to our segments. Members served by our two segments often utilize the same provider networks, in
some instances enabling us to obtain more favorable contract terms with providers. Our segments also share
indirect overhead costs and assets. As a result, the profitability of each segment is interdependent.
Our Products
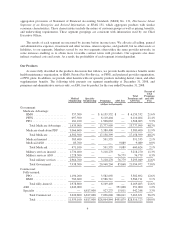
As more fully described in the products discussion that follows, we provide health insurance benefits under
health maintenance organization, or HMO, Private Fee-For-Service, or PFFS, and preferred provider organization,
or PPO, plans. In addition, we provide other benefits with our specialty products including dental, vision, and other
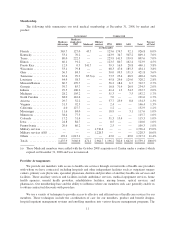
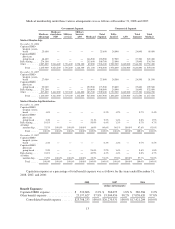
supplementary benefits. The following table presents our segment membership at December 31, 2008, and
premiums and administrative services only, or ASO, fees by product for the year ended December 31, 2008:
Medical
Membership
Specialty
Membership Premiums ASO Fees
Total
Premiums and
ASO Fees
Percent of
Total
Premiums
and ASO
Fees
(dollars in thousands)
Government:
Medicare Advantage:
HMO ...................... 557,300 — $ 6,159,532 $ — $ 6,159,532 21.6%
PFFS ...................... 697,500 — 6,110,404 — 6,110,404 21.4%
PPO ....................... 181,100 — 1,508,063 — 1,508,063 5.3%
Total Medicare Advantage . . . 1,435,900 — 13,777,999 — 13,777,999 48.3%
Medicare stand-alone PDP ..... 3,066,600 — 3,380,400 — 3,380,400 11.9%
Total Medicare ............ 4,502,500 — 17,158,399 — 17,158,399 60.2%
Medicaid insured ............. 385,400 — 591,535 591,535 2.1%
Medicaid ASO ............... 85,700 — — 9,089 9,089 0.0%
Total Medicaid ............ 471,100 — 591,535 9,089 600,624 2.1%
Military services insured ....... 1,736,400 — 3,218,270 — 3,218,270 11.3%
Military services ASO ......... 1,228,300 — — 76,779 76,779 0.3%
Total military services ....... 2,964,700 — 3,218,270 76,779 3,295,049 11.6%
Total Government .......... 7,938,300 — 20,968,204 85,868 21,054,072 73.8%
Commercial:
Fully-insured:
PPO ....................... 1,196,200 — 3,582,692 — 3,582,692 12.6%
HMO ...................... 782,600 — 2,586,711 — 2,586,711 9.1%
Total fully-insured .......... 1,978,800 — 6,169,403 — 6,169,403 21.6%
ASO......................... 1,642,000 — — 351,000 351,000 1.2%
Specialty ..................... — 6,817,000 927,237 15,011 942,248 3.3%
Total Commercial .......... 3,620,800 6,817,000 7,096,640 366,011 7,462,651 26.2%
Total .................... 11,559,100 6,817,000 $28,064,844 $451,879 $28,516,723 100.0%
4