Humana 2008 Annual Report Download - page 43
Download and view the complete annual report
Please find page 43 of the 2008 Humana annual report below. You can navigate through the pages in the report by either clicking on the pages listed below, or by using the keyword search tool below to find specific information within the annual report.-
 1
1 -
2
-
3
-
4
-
5
-
6
-
7
-
8
-
9
-
10
-
11
-
12
-
13
-
14
-
15
-
16
-
17
-
18
-
19
-
20
-
21
-
22
-
23
-
24
-
25
-
26
-
27
-
28
-
29
-
30
-
31
-
32
-
 33
33 -
 34
34 -
 35
35 -
 36
36 -
 37
37 -
 38
38 -
 39
39 -
 40
40 -
 41
41 -
 42
42 -
 43
43 -
 44
44 -
 45
45 -
 46
46 -
 47
47 -
 48
48 -
 49
49 -
 50
50 -
 51
51 -
 52
52 -
 53
53 -
54
-
55
-
56
-
57
-
58
-
59
-
60
-
61
-
62
-
63
-
64
-
65
-
66
-
67
-
68
-
69
-
70
-
71
-
72
-
73
-
74
-
75
-
76
-
77
-
78
-
79
-
80
-
81
-
82
-
83
-
84
-
85
-
86
-
87
-
88
-
89
-
90
-
91
-
92
-
93
-
94
-
95
-
96
-
97
-
98
-
99
-
100
-
101
-
102
-
103
-
104
-
105
-
106
-
107
-
108
-
109
-
110
-
111
-
112
-
113
-
114
-
115
-
116
-
117
-
118
-
119
-
120
-
121
-
122
-
123
-
124
-
125
-
126
-
127
-
128
-
129
-
130
-
131
-
132
-
133
-
134
-
135
-
136
 |
 |

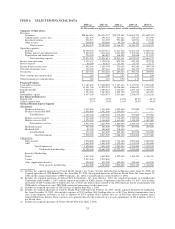
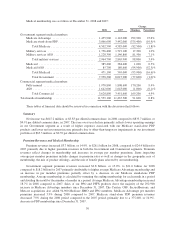
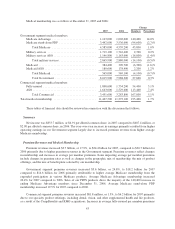
ITEM 6. SELECTED FINANCIAL DATA
2008 (a) 2007 (b) 2006 (c) 2005 (d) 2004 (e)
(in thousands, except per common share results, membership and ratios)
Summary of Operations:
Revenues:
Premiums .................................... $28,064,844 $24,434,347 $20,729,182 $14,001,591 $12,689,432
Administrative services fees ..................... 451,879 391,515 341,211 259,437 272,796
Investment income ............................. 220,215 314,239 291,880 142,976 132,838
Other revenue ................................. 209,434 149,888 54,264 14,123 9,259
Total revenues ............................ 28,946,372 25,289,989 21,416,537 14,418,127 13,104,325
Operating expenses:
Benefits ..................................... 23,708,233 20,270,531 17,421,204 11,651,470 10,669,647
Selling, general and administrative ................ 3,944,652 3,476,468 3,021,509 2,195,604 1,894,336
Depreciation and amortization .................... 220,350 184,812 148,598 128,858 117,792
Total operating expenses .................... 27,873,235 23,931,811 20,591,311 13,975,932 12,681,775
Income from operations ............................. 1,073,137 1,358,178 825,226 442,195 422,550
Interest expense ................................... 80,289 68,878 63,141 39,315 23,172
Income before income taxes ......................... 992,848 1,289,300 762,085 402,880 399,378
Provision for income taxes ........................... 345,694 455,616 274,662 106,150 129,431
Net income ....................................... $ 647,154 $ 833,684 $ 487,423 $ 296,730 $ 269,947
Basic earnings per common share ..................... $ 3.87 $ 5.00 $ 2.97 $ 1.83 $ 1.68
Diluted earnings per common share .................... $ 3.83 $ 4.91 $ 2.90 $ 1.79 $ 1.66
Financial Position:
Cash and investments ............................... $ 7,185,865 $ 6,690,820 $ 5,347,454 $ 3,477,955 $ 3,074,189
Total assets ....................................... 13,041,760 12,879,074 10,098,486 6,846,851 5,645,523
Benefits payable ................................... 3,205,579 2,696,833 2,410,407 1,849,142 1,389,845
Debt ............................................ 1,937,032 1,687,823 1,269,100 815,044 636,696
Stockholders’ equity ............................... 4,457,190 4,028,937 3,053,886 2,508,874 2,124,248
Key Financial Indicators:
Benefit ratio ...................................... 84.5% 83.0% 84.0% 83.2% 84.1%
SG&A expense ratio ............................... 13.7% 13.9% 14.3% 15.4% 14.6%
Medical Membership by Segment:
Government:
Medicare Advantage ........................... 1,435,900 1,143,000 1,002,600 557,800 377,200
Medicare stand-alone PDP ....................... 3,066,600 3,442,000 3,536,600 — —
Total Medicare ............................ 4,502,500 4,585,000 4,539,200 557,800 377,200
Military services insured ........................ 1,736,400 1,719,100 1,716,400 1,750,900 1,789,400
Military services ASO .......................... 1,228,300 1,146,800 1,163,600 1,138,200 1,082,400
Total military services ...................... 2,964,700 2,865,900 2,880,000 2,889,100 2,871,800
Medicaid insured .............................. 385,400 384,400 390,700 457,900 478,600
Medicaid ASO ................................ 85,700 180,600 178,400 — —
Total Medicaid ............................ 471,100 565,000 569,100 457,900 478,600
Total Government ..................... 7,938,300 8,015,900 7,988,300 3,904,800 3,727,600
Commercial:
Fully-insured ................................. 1,978,800 1,808,600 1,754,200 1,999,800 2,286,500
ASO ........................................ 1,642,000 1,643,000 1,529,600 1,171,000 1,018,600
Total Commercial ..................... 3,620,800 3,451,600 3,283,800 3,170,800 3,305,100
Total medical membership ........... 11,559,100 11,467,500 11,272,100 7,075,600 7,032,700
Specialty Membership:
Dental ....................................... 3,633,400 3,639,800 1,452,000 1,456,500 1,246,700
Vision ....................................... 2,233,000 2,272,800 — — —
Other supplemental benefits ...................... 950,600 871,200 450,800 445,600 461,500
Total specialty membership .......... 6,817,000 6,783,800 1,902,800 1,902,100 1,708,200
(a) Includes the acquired operations of United Health Group’s Las Vegas, Nevada individual SecureHorizons from April 30, 2008, the
acquired operations of OSF Health Plans, Inc. from May 22, 2008, the acquired operations of Metcare Health Plans, Inc. from August 29,
2008, and the acquired operations of PHP Companies, Inc. (d/b/a Cariten Healthcare) from October 31, 2008.
(b) Includes the acquired operations of DefenseWeb Technologies, Inc. from March 1, 2007, the acquired operations of CompBenefits
Corporation from October 1, 2007, and the acquired operations of KMG America Corporation from November 30, 2007. Also includes
the benefit of $68.9 million ($43.0 million after tax, or $0.25 per diluted share) related to our 2006 Medicare Part D reconciliation with
CMS and the settlement of some TRICARE contractual provisions related to prior years.
(c) Includes the acquired operations of CHA Service Company from May 1, 2006.
(d) Includes the acquired operations of CarePlus Health Plans of Florida from February 16, 2005, and the acquired operations of Corphealth,
Inc. from December 20, 2005. Also includes expenses of $71.9 million ($44.8 million after tax, or $0.27 per diluted common share) for a
class action litigation settlement, as well as expenses of $27.0 million ($16.9 million after tax, or $0.10 per diluted common share)
related to Hurricane Katrina. These expenses were partially offset by the realization of a tax gain contingency of $22.8 million, or $0.14
per diluted share.
(e) Includes the acquired operations of Ochsner Health Plan from April 1, 2004.
33