Humana 2008 Annual Report Download - page 51
Download and view the complete annual report
Please find page 51 of the 2008 Humana annual report below. You can navigate through the pages in the report by either clicking on the pages listed below, or by using the keyword search tool below to find specific information within the annual report.-
 1
1 -
2
-
3
-
4
-
5
-
6
-
7
-
8
-
9
-
10
-
11
-
12
-
13
-
14
-
15
-
16
-
17
-
18
-
19
-
20
-
21
-
22
-
23
-
24
-
25
-
26
-
27
-
28
-
29
-
30
-
31
-
32
-
33
-
34
-
35
-
36
-
37
-
38
-
39
-
40
-
 41
41 -
 42
42 -
 43
43 -
 44
44 -
 45
45 -
 46
46 -
 47
47 -
 48
48 -
 49
49 -
 50
50 -
 51
51 -
 52
52 -
 53
53 -
 54
54 -
 55
55 -
 56
56 -
 57
57 -
 58
58 -
 59
59 -
 60
60 -
 61
61 -
62
-
63
-
64
-
65
-
66
-
67
-
68
-
69
-
70
-
71
-
72
-
73
-
74
-
75
-
76
-
77
-
78
-
79
-
80
-
81
-
82
-
83
-
84
-
85
-
86
-
87
-
88
-
89
-
90
-
91
-
92
-
93
-
94
-
95
-
96
-
97
-
98
-
99
-
100
-
101
-
102
-
103
-
104
-
105
-
106
-
107
-
108
-
109
-
110
-
111
-
112
-
113
-
114
-
115
-
116
-
117
-
118
-
119
-
120
-
121
-
122
-
123
-
124
-
125
-
126
-
127
-
128
-
129
-
130
-
131
-
132
-
133
-
134
-
135
-
136
 |
 |
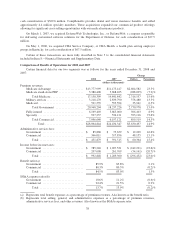
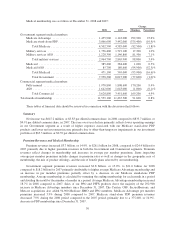
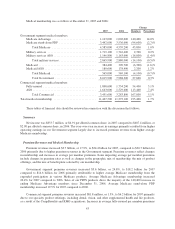
SG&A Expense
Consolidated SG&A expenses increased $468.2 million, or 13.5%, during 2008 compared to 2007. The
increases primarily resulted from an increase in the number of employees due to the Medicare growth, and the
CompBenefits and KMG acquisitions. The number of employees increased by 3,900 to 28,900 at December 31,
2008 from 25,000 at December 31, 2007, or 15.6%.
The consolidated SG&A expense ratio for 2008 was 13.7%, decreasing 20 basis points from 13.9% for 2007
primarily due to improving administrative cost efficiency associated with servicing higher average Medicare
Advantage and Commercial medical membership, partially offset by growth in certain of our businesses which
carry a higher administrative expense load such as mail-order pharmacy, specialty products, and individual
medical products. The consolidated SG&A expense ratio is expected to be in the range of 13% to 14% for 2009.
Our Government and Commercial segments bear both direct and shared indirect overhead SG&A expenses.
We allocate the indirect overhead expenses shared by the two segments primarily as a function of revenues. As a
result, the profitability of each segment is interdependent.
SG&A expenses in the Government segment increased $180.9 million, or 8.9%, during 2008 compared to
2007. The Government segment SG&A expense ratio decreased 60 basis points from 11.2% for 2007 to 10.6%
for 2008. The decrease primarily resulted from efficiency gains associated with servicing higher average
Medicare Advantage membership.
The Commercial segment SG&A expenses increased $287.3 million, or 20.0%, during 2008 compared to
2007. The Commercial segment SG&A expense ratio increased 90 basis points from 21.5% for 2007 to 22.4%
for 2008. The increases primarily were due to an increase in specialty business, including the acquisition of
CompBenefits and KMG in the fourth quarter of 2007, together with higher average individual product
membership and increased mail-order pharmacy business. Average individual product membership increased
40.5% during 2008 compared to 2007. Specialty and individual accounts bear a higher SG&A expense ratio due
to higher distribution costs as compared to larger accounts.
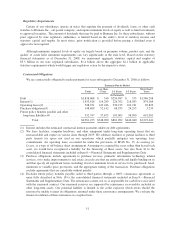
Depreciation and Amortization
Depreciation and amortization for 2008 totaled $220.4 million compared to $184.8 million for 2007, an
increase of $35.6 million, or 19.3%, reflecting higher intangible amortization expense due to acquisitions and
increased capital expenditures.
Interest Expense
Interest expense was $80.3 million for 2008, compared to $68.9 million for 2007, an increase of $11.4
million, primarily due to higher average outstanding debt, partially offset by lower rates.
Income Taxes
Our effective tax rate for 2008 of 34.8% compared to the effective tax rate of 35.3% for 2007. The decrease
primarily was due to a lower combined state income tax rate and a greater proportion of tax-exempt investment
income to total pretax income in 2008. See Note 10 to the consolidated financial statements included in Item 8.—
Financial Statements and Supplementary Data for a complete reconciliation of the federal statutory rate to the
effective tax rate. We expect the 2009 effective tax rate to be in the range of 34% to 35%.
41