Humana 2008 Annual Report Download - page 44
Download and view the complete annual report
Please find page 44 of the 2008 Humana annual report below. You can navigate through the pages in the report by either clicking on the pages listed below, or by using the keyword search tool below to find specific information within the annual report.-
 1
1 -
2
-
3
-
4
-
5
-
6
-
7
-
8
-
9
-
10
-
11
-
12
-
13
-
14
-
15
-
16
-
17
-
18
-
19
-
20
-
21
-
22
-
23
-
24
-
25
-
26
-
27
-
28
-
29
-
30
-
31
-
32
-
33
-
 34
34 -
 35
35 -
 36
36 -
 37
37 -
 38
38 -
 39
39 -
 40
40 -
 41
41 -
 42
42 -
 43
43 -
 44
44 -
 45
45 -
 46
46 -
 47
47 -
 48
48 -
 49
49 -
 50
50 -
 51
51 -
 52
52 -
 53
53 -
 54
54 -
55
-
56
-
57
-
58
-
59
-
60
-
61
-
62
-
63
-
64
-
65
-
66
-
67
-
68
-
69
-
70
-
71
-
72
-
73
-
74
-
75
-
76
-
77
-
78
-
79
-
80
-
81
-
82
-
83
-
84
-
85
-
86
-
87
-
88
-
89
-
90
-
91
-
92
-
93
-
94
-
95
-
96
-
97
-
98
-
99
-
100
-
101
-
102
-
103
-
104
-
105
-
106
-
107
-
108
-
109
-
110
-
111
-
112
-
113
-
114
-
115
-
116
-
117
-
118
-
119
-
120
-
121
-
122
-
123
-
124
-
125
-
126
-
127
-
128
-
129
-
130
-
131
-
132
-
133
-
134
-
135
-
136
 |
 |
ITEM 7. MANAGEMENT’S DISCUSSION AND ANALYSIS OF FINANCIAL CONDITION
AND RESULTS OF OPERATIONS
Overview
Headquartered in Louisville, Kentucky, Humana is one of the nation’s largest publicly traded health and
supplemental benefits companies, based on our 2008 revenues of $28.9 billion. We are a full-service benefits
solutions company, offering a wide array of health and supplemental benefit products for employer groups,
government benefit programs, and individuals. As of December 31, 2008, we had approximately 11.6 million
members enrolled in our medical benefit plans, as well as approximately 6.8 million members enrolled in our
specialty products.
We manage our business with two segments: Government and Commercial. The Government segment
consists of beneficiaries of government benefit programs, and includes three lines of business: Medicare,
Military, and Medicaid. The Commercial segment consists of members enrolled in our medical and specialty
products marketed to employer groups and individuals. We identified our segments in accordance with the
aggregation provisions of SFAS 131,which aggregates products with similar economic characteristics. These
characteristics include the nature of customer groups as well as pricing, benefits, and underwriting requirements.
These segment groupings are consistent with information used by our Chief Executive Officer.
The results of each segment are measured by income before income taxes. We allocate all selling, general
and administrative expenses, investment and other revenue, interest expense, and goodwill, but no other assets or
liabilities, to our segments. Members served by our two segments often utilize the same provider networks, in
some instances enabling us to obtain more favorable contract terms with providers. Our segments also share
indirect overhead costs and assets. As a result, the profitability of each segment is interdependent.
Our results are impacted by many factors, but most notably are influenced by our ability to establish and
maintain a competitive and efficient cost structure and to accurately and consistently establish competitive
premium, ASO fee, and plan benefit levels that are commensurate with our benefit and administrative costs.
Benefit costs are subject to a high rate of inflation due to many forces, including new higher priced technologies
and medical procedures, new prescription drugs and therapies, an aging population, lifestyle challenges including
obesity and smoking, the tort liability system, and government regulation.
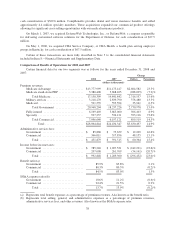
Our industry relies on two key statistics to measure performance. The benefit ratio, which is computed by
taking total benefit expenses as a percentage of premium revenues, represents a statistic used to measure
underwriting profitability. The selling, general, and administrative expense ratio, or SG&A expense ratio, which
is computed by taking total selling, general and administrative expenses as a percentage of premium revenues,
administrative services fees and other revenues, represents a statistic used to measure administrative spending
efficiency.
Government Segment
Our strategy and commitment to the Medicare programs has led to significant growth over the last three
years. Medicare Advantage membership increased to 1,435,900 members at December 31, 2008, up 292,900
members, or 25.6% from 1,143,000 members at December 31, 2007, primarily due to sales of preferred provider
organization, or PPO, and Private Fee-For-Service, PFFS, products. The acquisitions of PHP Companies, Inc.
(d/b/a Cariten Healthcare), or Cariten, OSF Health Plans, Inc., or OSF, SecureHorizons, and Metcare Health
Plans, Inc., or Metcare, also added 94,900 Medicare HMO and PPO members. Likewise, Medicare Advantage
premium revenues have increased 23.3% to $13.8 billion for 2008 from $11.2 billion for 2007. In addition,
recently the mix of sales has shifted increasingly to our network-based PPO offerings. We expect Medicare
Advantage membership to increase by 25,000 to 75,000 members in 2009. Nearly 60% of our January 2009
Medicare Advantage members are enrolled in network-based products. Our PPO membership increased 57%
from December 2008 to January 2009, including the voluntary move of 65,000 of our PFFS members.
34