Humana 2008 Annual Report Download - page 55
Download and view the complete annual report
Please find page 55 of the 2008 Humana annual report below. You can navigate through the pages in the report by either clicking on the pages listed below, or by using the keyword search tool below to find specific information within the annual report.-
 1
1 -
2
-
3
-
4
-
5
-
6
-
7
-
8
-
9
-
10
-
11
-
12
-
13
-
14
-
15
-
16
-
17
-
18
-
19
-
20
-
21
-
22
-
23
-
24
-
25
-
26
-
27
-
28
-
29
-
30
-
31
-
32
-
33
-
34
-
35
-
36
-
37
-
38
-
39
-
40
-
41
-
42
-
43
-
44
-
 45
45 -
 46
46 -
 47
47 -
 48
48 -
 49
49 -
 50
50 -
 51
51 -
 52
52 -
 53
53 -
 54
54 -
 55
55 -
 56
56 -
 57
57 -
 58
58 -
 59
59 -
 60
60 -
 61
61 -
 62
62 -
 63
63 -
 64
64 -
 65
65 -
66
-
67
-
68
-
69
-
70
-
71
-
72
-
73
-
74
-
75
-
76
-
77
-
78
-
79
-
80
-
81
-
82
-
83
-
84
-
85
-
86
-
87
-
88
-
89
-
90
-
91
-
92
-
93
-
94
-
95
-
96
-
97
-
98
-
99
-
100
-
101
-
102
-
103
-
104
-
105
-
106
-
107
-
108
-
109
-
110
-
111
-
112
-
113
-
114
-
115
-
116
-
117
-
118
-
119
-
120
-
121
-
122
-
123
-
124
-
125
-
126
-
127
-
128
-
129
-
130
-
131
-
132
-
133
-
134
-
135
-
136
 |
 |
pharmacy costs in the early stages of a member’s plan period and less in the later stages, resulting in a declining
benefit ratio as the year progresses. An extended enrollment period in 2006, which ended June 30, 2006, skewed
the standard pattern associated with the progression of members through the stages of Medicare Part D benefits.
Regarding the Complete plan, benefit design changes improved the performance of that offering. Changes in
estimates associated with our 2006 Medicare Part D reconciliation with CMS and the settlement of some
TRICARE contractual provisions related to the prior years decreased the benefit ratio 40 basis points for 2007.
These changes in estimates resulted from 1) the resolution of first year Medicare Part D implementation matters
including enrollment discrepancies; and 2) the adjustment of certain TRICARE reserves as a result of the
settlement of claims payment accuracy and risk share provisions for prior option periods.
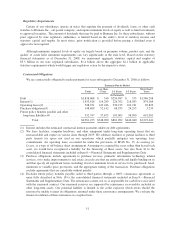
The Commercial segment’s benefit expenses decreased $6.2 million, or 0.1%, from 2006 to 2007. This
decrease primarily results from the decrease in fully-insured group membership partially offset by the increase in
average per member claims costs due to medical expense inflation.
The benefit ratio for the Commercial segment of 80.5% for 2007 decreased 120 basis points from the 2006
benefit ratio of 81.7%. The decrease in the benefit ratio primarily reflects an increase in the percentage of
individual and small group members comprising our total fully-insured block, the CompBenefits and KMG
acquisitions which added dental, vision, and other supplemental health and life members, and improving medical
cost utilization. Individual and smaller group as well as specialty, primarily dental and vision, accounts generally
carry a lower benefit ratio and a higher SG&A expense ratio compared to larger accounts due to higher
distribution costs. See related SG&A expense ratio discussion in the following section.
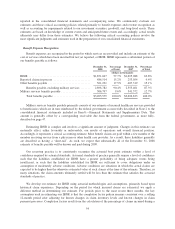
SG&A Expense
Consolidated SG&A expenses increased $455.0 million, or 15.1%, during 2007 compared to 2006. The
increase primarily resulted from an increase in the number of employees due to the Medicare expansion,
expenses associated with RightSourceRxSM, our mail-order pharmacy, and higher Medicare marketing expenses
associated with higher sales goals for 2008 compared to 2007. The number of employees increased by 2,700 to
25,000 at December 31, 2007 from 22,300 at December 31, 2006, or 12.1%.
The consolidated SG&A expense ratio for 2007 was 13.9%, decreasing 40 basis points from 14.3% for
2006. The SG&A expense ratio decrease resulted from improving administrative cost efficiency associated with
servicing our members offset by our expanding mail-order pharmacy business as well as differences in the
composition of our medical membership portfolio for 2007 versus 2006.
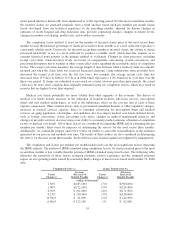
Our Government and Commercial segments bear both direct and shared indirect overhead SG&A expenses.
We allocate the indirect overhead expenses shared by the two segments primarily as a function of revenues. As a
result, the profitability of each segment is interdependent.
SG&A expenses in the Government segment increased $312.0 million, or 18.0%, during 2007 compared to
2006. The Government segment SG&A expense ratio decreased 60 basis points from 11.8% for 2006 to 11.2%
for 2007. The decrease primarily resulted from efficiency gains associated with servicing higher average
Medicare membership.
The Commercial segment SG&A expenses increased $143.0 million, or 11.1%, during 2007 compared to
2006. The Commercial segment SG&A expense ratio increased 150 basis points from 20.0% for 2006 to 21.5%
for 2007. This increase primarily resulted from the continued shift in the mix of membership towards ASO, an
increase in the percentage of individual and small group members comprising our fully-insured membership, and
administrative costs associated with increased business for our mail-order pharmacy. For 2007, 46.8% of our
Commercial segment average medical membership was related to ASO business compared to 44.5% for 2006.
Likewise, at December 31, 2007, 29.3% of our Commercial segment average medical membership was related to
individual and small group accounts compared to 27.7% at December 31, 2006. Fee based ASO business carries
45