Humana 2008 Annual Report Download - page 48
Download and view the complete annual report
Please find page 48 of the 2008 Humana annual report below. You can navigate through the pages in the report by either clicking on the pages listed below, or by using the keyword search tool below to find specific information within the annual report.-
 1
1 -
2
-
3
-
4
-
5
-
6
-
7
-
8
-
9
-
10
-
11
-
12
-
13
-
14
-
15
-
16
-
17
-
18
-
19
-
20
-
21
-
22
-
23
-
24
-
25
-
26
-
27
-
28
-
29
-
30
-
31
-
32
-
33
-
34
-
35
-
36
-
37
-
 38
38 -
 39
39 -
 40
40 -
 41
41 -
 42
42 -
 43
43 -
 44
44 -
 45
45 -
 46
46 -
 47
47 -
 48
48 -
 49
49 -
 50
50 -
 51
51 -
 52
52 -
 53
53 -
 54
54 -
 55
55 -
 56
56 -
 57
57 -
 58
58 -
59
-
60
-
61
-
62
-
63
-
64
-
65
-
66
-
67
-
68
-
69
-
70
-
71
-
72
-
73
-
74
-
75
-
76
-
77
-
78
-
79
-
80
-
81
-
82
-
83
-
84
-
85
-
86
-
87
-
88
-
89
-
90
-
91
-
92
-
93
-
94
-
95
-
96
-
97
-
98
-
99
-
100
-
101
-
102
-
103
-
104
-
105
-
106
-
107
-
108
-
109
-
110
-
111
-
112
-
113
-
114
-
115
-
116
-
117
-
118
-
119
-
120
-
121
-
122
-
123
-
124
-
125
-
126
-
127
-
128
-
129
-
130
-
131
-
132
-
133
-
134
-
135
-
136
 |
 |

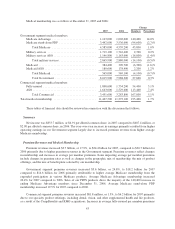
cash consideration of $369.6 million. CompBenefits provides dental and vision insurance benefits and added
approximately 4.4 million specialty members. These acquisitions expanded our commercial product offerings
allowing for significant cross-selling opportunities with our medical insurance products.
On March 1, 2007, we acquired DefenseWeb Technologies, Inc., or DefenseWeb, a company responsible
for delivering customized software solutions for the Department of Defense, for cash consideration of $27.5
million.
On May 1, 2006, we acquired CHA Service Company, or CHA Health, a health plan serving employer
groups in Kentucky, for cash consideration of $67.5 million.
Certain of these transactions are more fully described in Note 3 to the consolidated financial statements
included in Item 8.—Financial Statements and Supplementary Data.
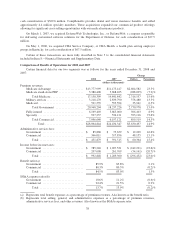
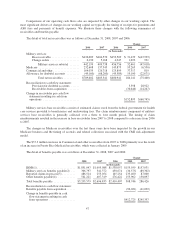
Comparison of Results of Operations for 2008 and 2007
Certain financial data for our two segments was as follows for the years ended December 31, 2008 and
2007:
2008 2007
Change
Dollars Percentage
(dollars in thousands)
Premium revenues:
Medicare Advantage ..................... $13,777,999 $11,173,417 $2,604,582 23.3%
Medicare stand-alone PDP ................. 3,380,400 3,668,425 (288,025) (7.9)%
Total Medicare ...................... 17,158,399 14,841,842 2,316,557 15.6%
Military services ......................... 3,218,270 2,839,790 378,480 13.3%
Medicaid ............................... 591,535 555,594 35,941 6.5%
Total Government ................... 20,968,204 18,237,226 2,730,978 15.0%
Fully-insured ........................... 6,169,403 5,663,000 506,403 8.9%
Specialty ............................... 927,237 534,121 393,116 73.6%
Total Commercial .................... 7,096,640 6,197,121 899,519 14.5%
Total .......................... $28,064,844 $24,434,347 $3,630,497 14.9%
Administrative services fees:
Government ............................ $ 85,868 $ 73,659 $ 12,209 16.6%
Commercial ............................ 366,011 317,856 48,155 15.1%
Total .............................. $ 451,879 $ 391,515 $ 60,364 15.4%
Income before income taxes:
Government ............................ $ 785,240 $ 1,027,531 $ (242,291) (23.6)%
Commercial ............................ 207,608 261,769 (54,161) (20.7)%
Total .............................. $ 992,848 $ 1,289,300 $ (296,452) (23.0)%
Benefit ratios(a):
Government ............................ 85.9% 83.8% 2.1%
Commercial ............................ 80.3% 80.5% (0.2)%
Total .............................. 84.5% 83.0% 1.5%
SG&A expense ratios(b):
Government ............................ 10.6% 11.2% (0.6)%
Commercial ............................ 22.4% 21.5% 0.9%
Total .............................. 13.7% 13.9% (0.2)%
(a) Represents total benefit expenses as a percentage of premium revenues. Also known as the benefit ratio.
(b) Represents total selling, general, and administrative expenses as a percentage of premium revenues,
administrative services fees, and other revenues. Also known as the SG&A expense ratio.
38