Humana 2008 Annual Report Download - page 66
Download and view the complete annual report
Please find page 66 of the 2008 Humana annual report below. You can navigate through the pages in the report by either clicking on the pages listed below, or by using the keyword search tool below to find specific information within the annual report.-
 1
1 -
2
-
3
-
4
-
5
-
6
-
7
-
8
-
9
-
10
-
11
-
12
-
13
-
14
-
15
-
16
-
17
-
18
-
19
-
20
-
21
-
22
-
23
-
24
-
25
-
26
-
27
-
28
-
29
-
30
-
31
-
32
-
33
-
34
-
35
-
36
-
37
-
38
-
39
-
40
-
41
-
42
-
43
-
44
-
45
-
46
-
47
-
48
-
49
-
50
-
51
-
52
-
53
-
54
-
55
-
 56
56 -
 57
57 -
 58
58 -
 59
59 -
 60
60 -
 61
61 -
 62
62 -
 63
63 -
 64
64 -
 65
65 -
 66
66 -
 67
67 -
 68
68 -
 69
69 -
 70
70 -
 71
71 -
 72
72 -
 73
73 -
 74
74 -
 75
75 -
 76
76 -
77
-
78
-
79
-
80
-
81
-
82
-
83
-
84
-
85
-
86
-
87
-
88
-
89
-
90
-
91
-
92
-
93
-
94
-
95
-
96
-
97
-
98
-
99
-
100
-
101
-
102
-
103
-
104
-
105
-
106
-
107
-
108
-
109
-
110
-
111
-
112
-
113
-
114
-
115
-
116
-
117
-
118
-
119
-
120
-
121
-
122
-
123
-
124
-
125
-
126
-
127
-
128
-
129
-
130
-
131
-
132
-
133
-
134
-
135
-
136
 |
 |

(a) Reflects estimated potential changes in benefits payable caused by changes in completion factors for
incurred months prior to the most recent three months.
(b) Reflects estimated potential changes in benefits payable caused by changes in annualized claims trend used
for the estimation of per member per month incurred claims for the most recent three months.
(c) The factor change indicated represents the percentage point change.
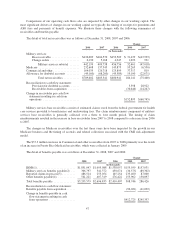
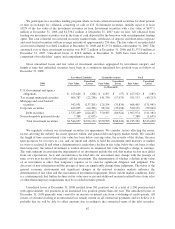
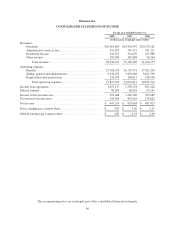
The following table provides a historical perspective regarding the accrual and payment of our benefits
payable, excluding military services. Components of the total incurred claims for each year include amounts
accrued for current year estimated benefit expenses as well as adjustments to prior year estimated accruals.
2008 2007 2006
(in thousands)
Balances at January 1 ................................... $ 2,355,461 $ 1,979,733 $ 1,334,716
Acquisitions ........................................... 96,021 41,029 21,198
Incurred related to:
Current year ....................................... 21,092,135 18,015,247 15,374,855
Prior years ........................................ (268,027) (242,922) (178,998)
Total incurred ................................. 20,824,108 17,772,325 15,195,857
Paid related to:
Current year ....................................... (18,832,301) (16,012,828) (13,532,139)
Prior years ........................................ (1,544,507) (1,424,798) (1,039,899)
Total paid ..................................... (20,376,808) (17,437,626) (14,572,038)
Balances at December 31 ................................ $ 2,898,782 $ 2,355,461 $ 1,979,733
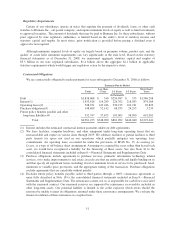
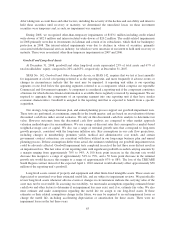
The following table summarizes the changes in estimate for incurred claims related to prior years
attributable to our key assumptions. As previously described, our key assumptions consist of trend and
completion factors estimated using an assumption of moderately adverse conditions. The amounts below
represent the difference between our original estimates and the actual benefit expenses ultimately incurred as
determined from subsequent claim payments.
Favorable Development by Changes in Key Assumptions
2008 2007 2006
Amount
Factor
Change (a) Amount
Factor
Change (a) Amount
Factor
Change (a)
(dollars in thousands)
Trend factors .................... $(175,268) (5.2)% $(124,957) (4.3)% $(136,457) (6.4)%
Completion factors ............... (92,759) 1.0% (63,985) 0.8% (42,541) 0.7%
Medicare Part D reconciliation ...... — n/a (53,980) n/a — n/a
Total ....................... $(268,027) $(242,922) $(178,998)
(a) The factor change indicated represents the percentage point change.
As summarized in the table above, the majority of the favorable development resulted from trend factors for
the most recent three months ultimately being lower than originally estimated for each of the years presented.
Several factors drove the actual trend factors lower than the originally estimated trends:
• Utilization of hospital and physician services ultimately was lower than our original estimates for both
our Commercial and Medicare lines of business.
• Rapid growth in our Medicare private fee-for-service product in new geographic areas resulted in more
limited historical information from which to base trend rate estimates.
56