Humana 2008 Annual Report Download - page 127
Download and view the complete annual report
Please find page 127 of the 2008 Humana annual report below. You can navigate through the pages in the report by either clicking on the pages listed below, or by using the keyword search tool below to find specific information within the annual report.-
 1
1 -
2
-
3
-
4
-
5
-
6
-
7
-
8
-
9
-
10
-
11
-
12
-
13
-
14
-
15
-
16
-
17
-
18
-
19
-
20
-
21
-
22
-
23
-
24
-
25
-
26
-
27
-
28
-
29
-
30
-
31
-
32
-
33
-
34
-
35
-
36
-
37
-
38
-
39
-
40
-
41
-
42
-
43
-
44
-
45
-
46
-
47
-
48
-
49
-
50
-
51
-
52
-
53
-
54
-
55
-
56
-
57
-
58
-
59
-
60
-
61
-
62
-
63
-
64
-
65
-
66
-
67
-
68
-
69
-
70
-
71
-
72
-
73
-
74
-
75
-
76
-
77
-
78
-
79
-
80
-
81
-
82
-
83
-
84
-
85
-
86
-
87
-
88
-
89
-
90
-
91
-
92
-
93
-
94
-
95
-
96
-
97
-
98
-
99
-
100
-
101
-
102
-
103
-
104
-
105
-
106
-
107
-
108
-
109
-
110
-
111
-
112
-
113
-
114
-
115
-
116
-
 117
117 -
 118
118 -
 119
119 -
 120
120 -
 121
121 -
 122
122 -
 123
123 -
 124
124 -
 125
125 -
 126
126 -
 127
127 -
 128
128 -
 129
129 -
 130
130 -
 131
131 -
 132
132 -
 133
133 -
 134
134 -
 135
135 -
 136
136
 |
 |

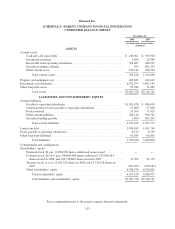
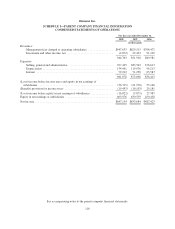
Humana Inc.
SCHEDULE I—PARENT COMPANY FINANCIAL INFORMATION
CONDENSED STATEMENTS OF CASH FLOWS
For the year ended December 31,
2008 2007 2006
(in thousands)
Net cash provided by operating activities ...................... $ 547,813 $ 682,374 $ 330,722
Cash flows from investing activities:
Acquisitions ........................................... (341,288) (548,251) (2,810)
Purchases of investment securities .......................... (7,528) (25,147) (119,753)
Proceeds from sale of investment securities .................. 28,868 100,001 264,439
Maturities of investment securities ......................... 2,489 15,213 29,005
Purchases of property and equipment, net .................... (195,517) (139,962) (147,719)
Capital contributions to operating subsidiaries ................ (467,750) (307,340) (723,501)
Surplus note redemption from operating subsidiaries ........... — — 7,000
Change in securities lending collateral ...................... 400,292 (400,211) 902
Other ................................................. — — 29
Net cash used in investing activities .................... (580,434) (1,305,697) (692,408)
Cash flows from financing activities:
Borrowings under credit agreement ......................... 1,175,000 1,685,000 550,000
Repayments under credit agreement ........................ (1,725,000) (1,335,000) (300,000)
Proceeds from issuance of senior notes ...................... 749,247 — 498,545
Repayments of senior notes ............................... — — (300,000)
Debt issue costs ........................................ (6,696) — (5,980)
Proceeds from swap termination ........................... 93,008 — —
Repayment of notes issued to operating subsidiaries ............ — (9,450) —
Change in book overdraft ................................. (27,720) 876 9,306
Change in securities lending payable ........................ (400,292) 400,211 (902)
Common stock repurchases ............................... (106,070) (27,412) (26,211)
Tax benefit from stock-based compensation .................. 9,912 37,443 38,839
Proceeds from stock option exercises and other ............... 10,965 61,643 48,223
Net cash (used in) provided by financing activities ......... (227,646) 813,311 511,820
(Decrease) increase in cash and cash equivalents .................. (260,267) 189,988 150,134
Cash and cash equivalents at beginning of year .................... 509,328 319,340 169,206
Cash and cash equivalents at end of year ......................... $ 249,061 $ 509,328 $ 319,340
See accompanying notes to the parent company financial statements.
117